ゴールデンクロス移動平均線突破ボリンジャーバンド戦略
概要
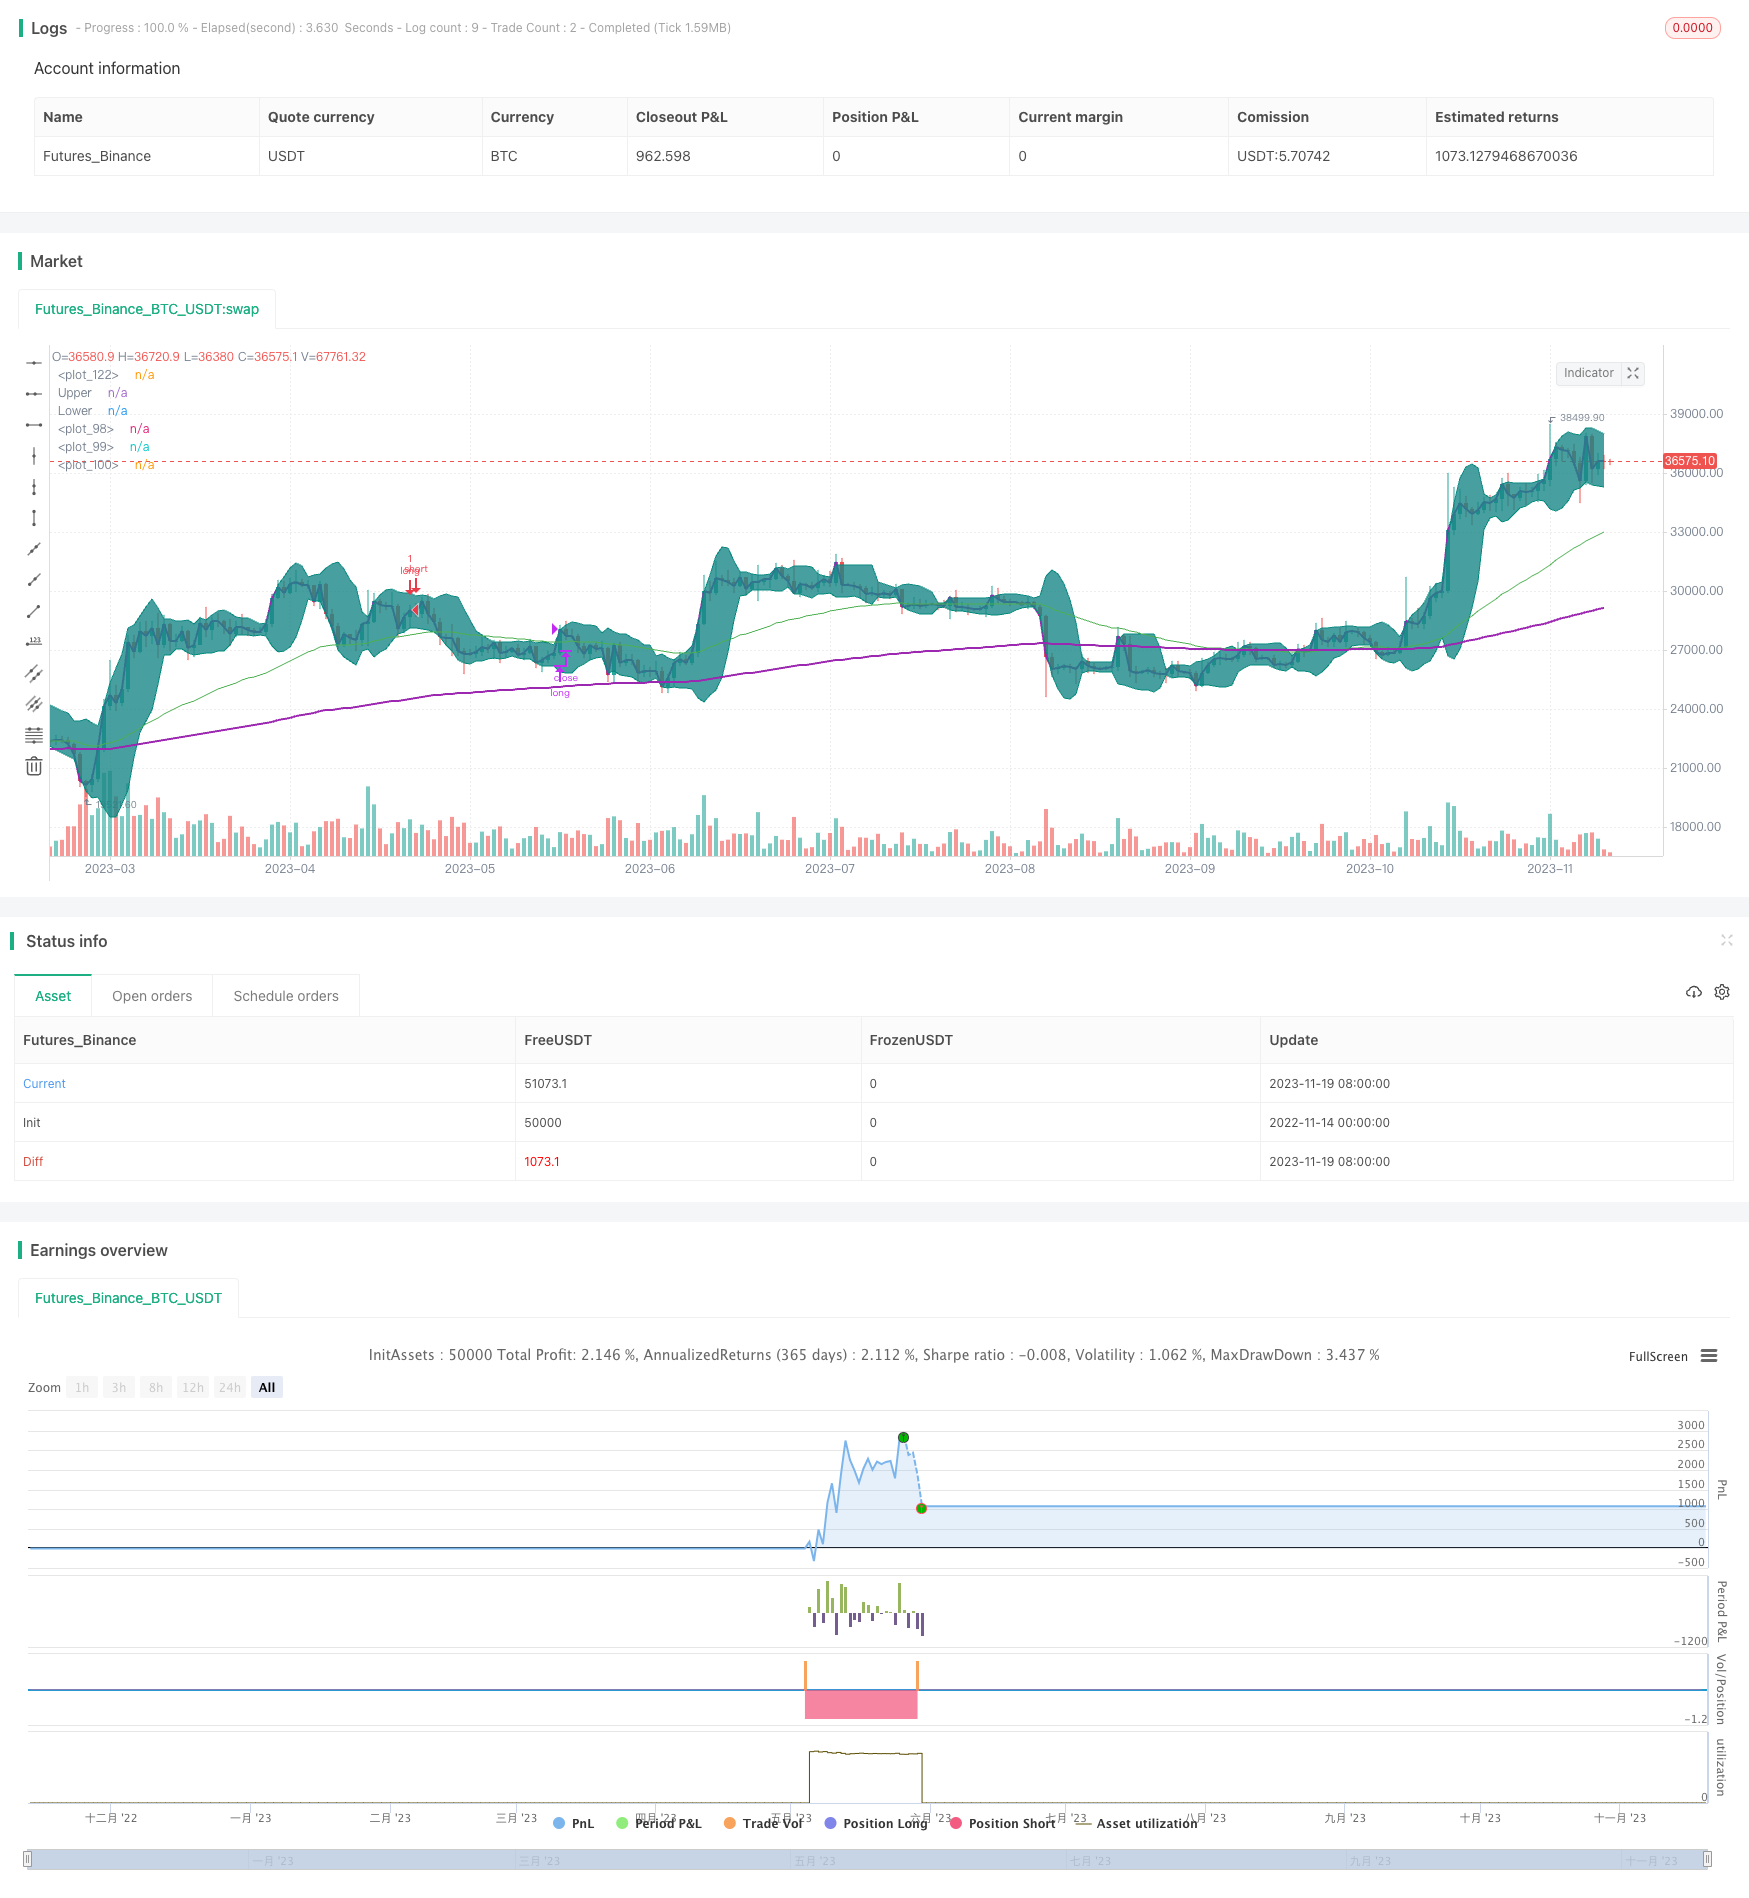
この戦略は,移動平均指数,ブリン帯指数,成交量加重平均物価指数を組み合わせて,金叉形成,短平均線で長平均線を穿越する条件で判断する.戦略は,ブリン帯通路を利用し,価格がブリン帯の下線に触れたときにのみ入場を考慮する.これにより,市場の変動中に頻繁に入場を避ける.
戦略原則
この戦略は,主に平均線指数によってトレンドの方向を判断し,ブリンを誘導して位置波動区間を選択する.具体的には,戦略には以下のいくつかの重要なルールが含まれています:
50日EMAと200日EMAを用いて金叉判断システムを構築し,速動平均を速動平均に横切ると多頭上昇傾向にあると考えます.
価格がVWAPより高くなると,価格が上昇する段階にあると判断し,さらに貯金をするのに有利であると考えます.
株価がブルインの下落線に触れたり突破したばかりで,反発点の近くにある可能性を示し,チャンスが優れている.
多頭持株に入ると,価格がブリンを上回ると,時効で止まり,退出する.
これらのルールの組み合わせにより,この戦略は,牛市で適切な買いポイントを選択し,利益を確保するためのストップ・ロストを設定することができます.
戦略的優位性
黄金フォークの判断システムを利用して,大きなトレンドの方向性を決定し,震動の状況で小勝小負を避ける.
VWAPは,価格の変動方向を判断し,購入ポイントの選択を精密にすることができる.
ブリン帯の指標は,買い点を判断し,戦略をより性のあるものとし,同時に,利益を固定するストップ・ストップを設定する.
複数の指標が相互検証され,戦略判断がより正確で信頼性がある.
戦略的リスクと解決策
金叉判定システムは誤信号を発する可能性があるため,均線周期の長さを適切に短縮し,他の指標の検証に協力する.
ブリン帯のパラメータを正しく設定しない場合,策略は有効性が失われ,ブリン帯周期および標準差パラメータを調整する必要があります.
止損ポイント設定は過度に緩やかであり,損失を効果的に制御することはできません. 止損範囲を適切に厳格にし,リスクを制御できるようにする必要があります.
戦略最適化の方向性
金叉均線組合せを最適化し,異なる均線パラメータをテストし,最適なパラメータを見つける.
異なる周期のブリン帯のパラメータをテストし,幅と分散性の最適なパラメータの組み合わせを見つける.
リスクを効果的に管理し,過度に誘発されないように,止損範囲をテストし,最適化します.
要約する
この戦略は,均線システム,ブリン帯,VWAP指標を総合的に使用し,入場タイミングを判断し,発見の機会と制御のリスクを両立してバランスを取っています. 後のパラメータの最適化と規則修正により,業界および市場における継続的な好機をロックすることが望まれています.
/*backtest
start: 2022-11-14 00:00:00
end: 2023-11-20 00:00:00
period: 1d
basePeriod: 1h
exchanges: [{"eid":"Futures_Binance","currency":"BTC_USDT"}]
*/

// This source code is subject to the terms of the Mozilla Public License 2.0 at https://mozilla.org/MPL/2.0/
// © mohanee

//@version=4
strategy(title="VWAP and BB strategy [$$]", overlay=true,pyramiding=2, default_qty_value=1, default_qty_type=strategy.fixed,    initial_capital=10000, currency=currency.USD)


fromDay = input(defval = 1, title = "From Day", minval = 1, maxval = 31)
fromMonth = input(defval = 6, title = "From Month", minval = 1, maxval = 12)
fromYear = input(defval = 2020, title = "From Year", minval = 1970)

// To Date Inputs
toDay = input(defval = 1, title = "To Day", minval = 1, maxval = 31)
toMonth = input(defval = 8, title = "To Month", minval = 1, maxval = 12)
toYear = input(defval = 2020, title = "To Year", minval = 1970)

// Calculate start/end date and time condition
DST = 1 //day light saving for usa
//--- Europe
London = iff(DST==0,"0000-0900","0100-1000")
//--- America
NewYork = iff(DST==0,"0400-1300","0500-1400")
//--- Pacific
Sydney = iff(DST==0,"1300-2200","1400-2300")
//--- Asia
Tokyo = iff(DST==0,"1500-2400","1600-0100")

//-- Time In Range
timeinrange(res, sess) => time(res, sess) != 0

london = timeinrange(timeframe.period, London)
newyork = timeinrange(timeframe.period, NewYork)

startDate = timestamp(fromYear, fromMonth, fromDay, 00, 00)
finishDate = timestamp(toYear, toMonth, toDay, 00, 00)
time_cond = time >= startDate and time <= finishDate


is_price_dipped_bb(pds,source1) =>
    t_bbDipped=false
    for i=1 to pds
        t_bbDipped:=  (t_bbDipped   or  close[i]<source1) ? true : false
        if t_bbDipped==true
            break
        else
            continue

    t_bbDipped


is_bb_per_dipped(pds,bbrSrc) =>
    t_bbDipped=false
    for i=1 to pds
        t_bbDipped:=  (t_bbDipped   or  bbrSrc[i]<=0) ? true : false
        if t_bbDipped==true
            break
        else
            continue

    t_bbDipped


// variables  BEGIN
shortEMA = input(50, title="fast EMA", minval=1)
longEMA = input(200, title="slow EMA", minval=1)

//BB

smaLength = input(7, title="BB SMA Length", minval=1)
bbsrc = input(close, title="BB Source")

strategyCalcOption = input(title="strategy to use", type=input.string, options=["BB", "BB_percentageB"],      defval="BB")


//addOnDivergence = input(true,title="Add to existing on Divergence")
//exitOption = input(title="exit on RSI or BB", type=input.string, options=["RSI", "BB"],      defval="BB")

//bbSource = input(title="BB  source", type=input.string, options=["close", "vwap"],      defval="close")

//vwap_res = input(title="VWAP Resolution", type=input.resolution, defval="session")
stopLoss = input(title="Stop Loss%", defval=1, minval=1)

//variables  END

longEMAval= ema(close, longEMA)
shortEMAval= ema(close, shortEMA)
ema200val = ema(close, 200)


vwapVal=vwap(close)


// Drawings

//plot emas
plot(shortEMAval, color = color.green, linewidth = 1, transp=0)
plot(longEMAval, color = color.orange, linewidth = 1, transp=0)
plot(ema200val, color = color.purple, linewidth = 2, style=plot.style_line ,transp=0)


//bollinger calculation
mult = input(2.0, minval=0.001, maxval=50, title="StdDev")
basis = sma(bbsrc, smaLength)
dev = mult * stdev(bbsrc, smaLength)
upperBand = basis + dev
lowerBand = basis - dev
offset = input(0, "Offset", type = input.integer, minval = -500, maxval = 500)

bbr = (bbsrc - lowerBand)/(upperBand - lowerBand)
//bollinger calculation

//plot bb
//plot(basis, "Basis", color=#872323, offset = offset)
p1 = plot(upperBand, "Upper", color=color.teal, offset = offset)
p2 = plot(lowerBand, "Lower", color=color.teal, offset = offset)
fill(p1, p2, title = "Background", color=#198787, transp=95)


plot(vwapVal, color = color.purple, linewidth = 2, transp=0)


// Colour background

//barcolor(shortEMAval>longEMAval and close<=lowerBand ? color.yellow: na)


//longCondition=  shortEMAval > longEMAval and  close>open and  close>vwapVal
longCondition=  ( shortEMAval > longEMAval  and close>open and close>vwapVal and close<upperBand ) //and time_cond //     and  close>=vwapVal


//Entry
strategy.entry(id="long", comment="VB LE" , long=true,  when= longCondition and ( strategyCalcOption=="BB"? is_price_dipped_bb(10,lowerBand) : is_bb_per_dipped(10,bbr)  )   and strategy.position_size<1 )   //is_price_dipped_bb(10,lowerBand))  //and strategy.position_size<1       is_bb_per_dipped(15,bbr)


//add to the existing position
strategy.entry(id="long", comment="Add" , long=true,  when=strategy.position_size>=1 and close<strategy.position_avg_price and close>vwapVal) //and time_cond)

barcolor(strategy.position_size>=1  ? color.blue: na)


strategy.close(id="long", comment="TP Exit",   when=crossover(close,upperBand) )

//stoploss
stopLossVal =   strategy.position_avg_price * (1-(stopLoss*0.01) )
//strategy.close(id="long", comment="SL Exit",   when= close < stopLossVal)

//strategy.risk.max_intraday_loss(stopLoss, strategy.percent_of_equity)