双方向波動性吸収戦略

作者: リン・ハーンチャオチャン開催日:2023年11月21日 12:04:19
タグ:

img

概要

この戦略は波動性を追跡する二方向取引戦略である.ストップ損失を設定するために平均真要範囲 (ATR) 指標を使用し,ストップ損失レベルを突破した価格に基づいてトレンド方向を決定する.トレンド方向が変化すると逆向きのポジションを開く.

戦略の論理

この戦略は波動性を計算するために3日間のATRを使用する.ATR値を係数で掛け算するとストップ損失レベルとして使用される.価格がストップ損失レベルを超えると,上昇傾向とみなし,価格がストップ損失レベルを下回るとロングポジションを閉じる.価格がストップ損失レベルを下回るとダウントレンドとして判断し,価格がストップ損失レベルを超えるとショートポジションを閉じる.トレンドが変化するとリバースポジションを開く.トレンド中にストップ損失レベルが最適化され,トレンドが変化するとリセットされる.

利点分析

  • ATR を使って市場の変動を動的に追跡し,ストップロスの発生の可能性を低減します.
  • 市場変動による双方向取引の利益
  • トレンド変化の初期にリバースポジションを開設し,より高い勝率を得る.

リスク分析

  • ATR の遅延により,極端な変動がストップ・ロスの失敗を引き起こす可能性があります.
  • 長期ポジションにはGAPリスクがあります
  • 頻繁に小利益で取引できる

リスクを軽減するために:より広いストップレベルでのATR係数を増加させ,取引頻度を制限し,最低得益レベルを設定する.

オプティマイゼーションの方向性

  • トレンド変化のシグナルを他の指標で組み合わせる
  • ATR パラメータを最適化
  • 取引サイズ制御を追加する

概要

ATRは,一般的には安定した二方向トレーリングストップ戦略である.ATRは引き下げを制御するために動的ストップレベルを設定する.二方向取引は利益の機会も増加させる.さらなる最適化は戦略をより堅牢なものにし,トレンドフォローする能力を向上させる.


/*backtest
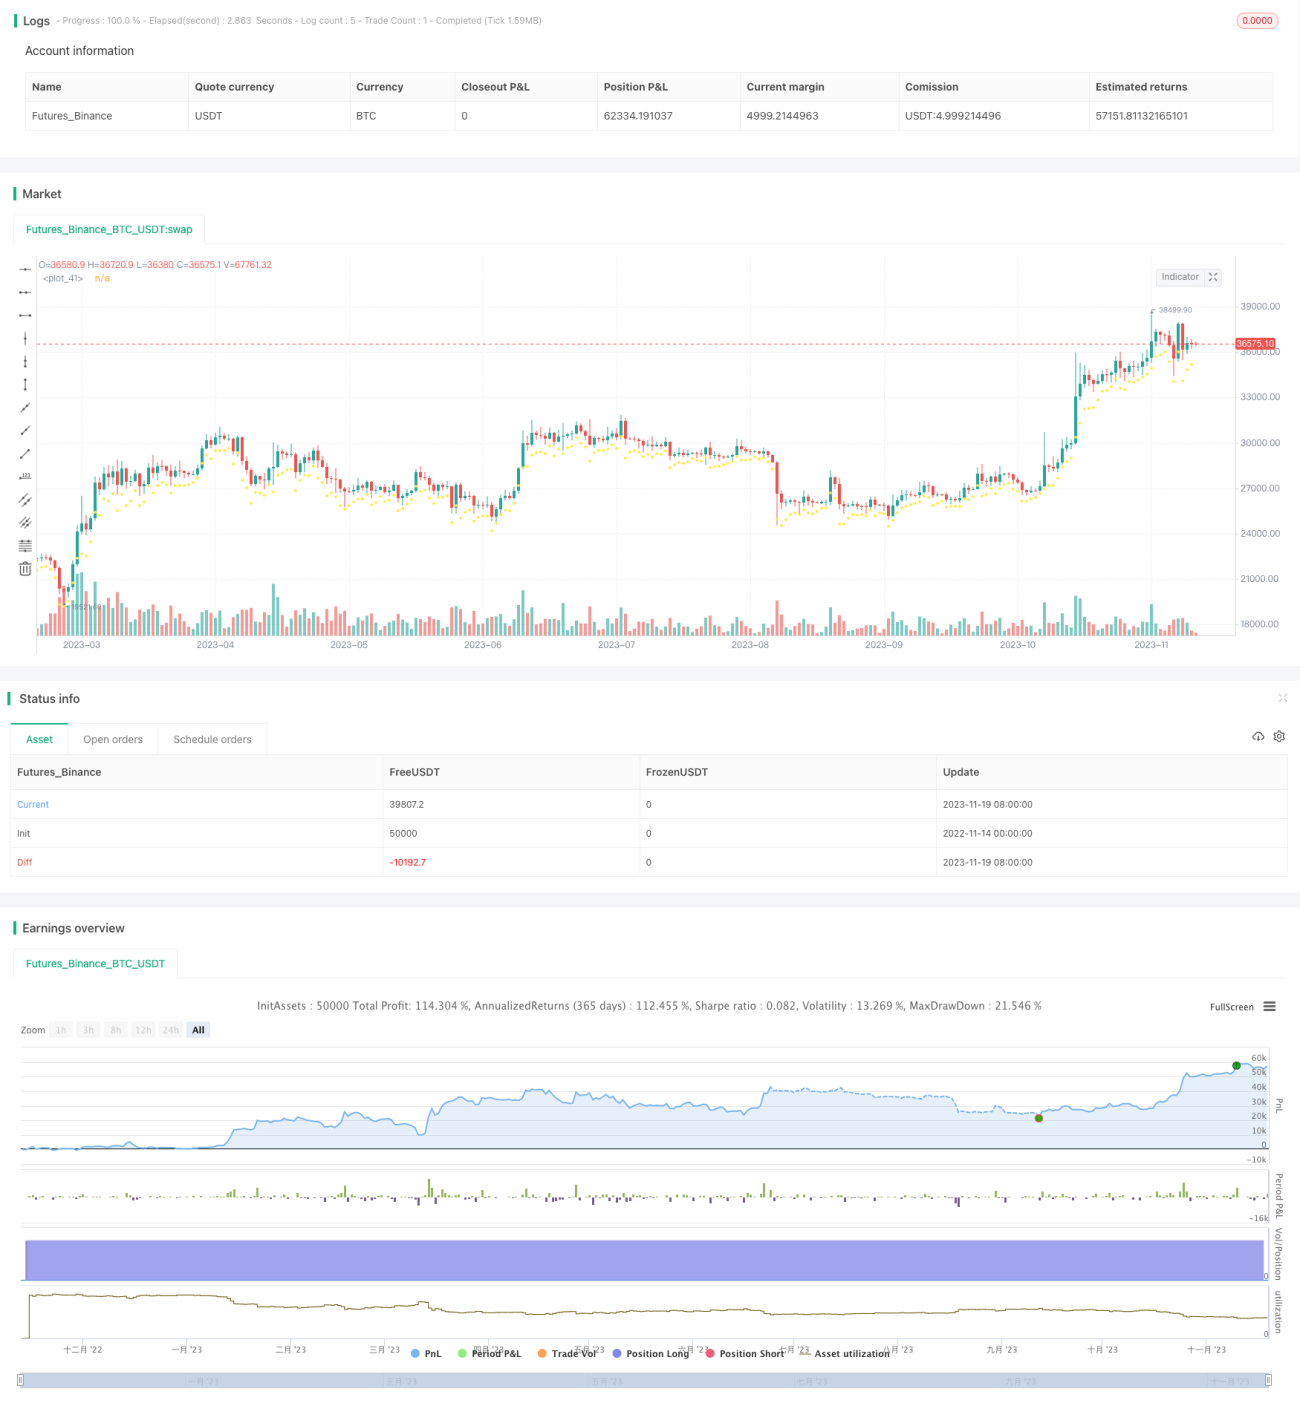
start: 2022-11-14 00:00:00
end: 2023-11-20 00:00:00
period: 1d
basePeriod: 1h
exchanges: [{"eid":"Futures_Binance","currency":"BTC_USDT"}]
*/

//@version=2
strategy("BCH Swinger v1", overlay=true, commission_value = 0.25, default_qty_type=strategy.percent_of_equity, default_qty_value = 100)

/////////////////////////////////////////////////////////////
//START - SET DATE RANGE

// === BACKTEST RANGE ===
FromMonth = input(defval = 1, title = "From Month", minval = 1)
FromDay   = input(defval = 1, title = "From Day", minval = 1)
FromYear  = input(defval = 2017, title = "From Year")
ToMonth   = input(defval = 10, title = "To Month", minval = 1)
ToDay     = input(defval = 01, title = "To Day", minval = 1)
ToYear    = input(defval = 2020, title = "To Year")

startDate = time > timestamp(FromYear, FromMonth, FromDay, 1, 1)
endDate = time < timestamp(ToYear, ToMonth, ToDay, 23, 59)
withinTimeRange = true

/////////////////////////////////////////////////////////////
//END - SET DATE RANGE


/////////////////////////////////////////////////////////////
//START - INDICATORS

length = input(3)
mult = input(1, minval = 0.01)
atr_ = atr(length)
max1 = max(nz(max_[1]), close)
min1 = min(nz(min_[1]), close)
is_uptrend_prev = nz(is_uptrend[1], true)
stop = is_uptrend_prev ? max1 - mult * atr_ : min1 + mult * atr_
vstop_prev = nz(vstop[1])
vstop1 = is_uptrend_prev ? max(vstop_prev, stop) : min(vstop_prev, stop)
is_uptrend = close - vstop1 >= 0
is_trend_changed = is_uptrend != is_uptrend_prev
max_ = is_trend_changed ? close : max1
min_ = is_trend_changed ? close : min1
vstop = is_trend_changed ? is_uptrend ? max_ - mult * atr_ : min_ + mult * atr_ : vstop1
plot(vstop, color = is_uptrend ? yellow : red, style=circles, linewidth=2)

/////////////////////////////////////////////////////////////
//END - INDICATORS


/////////////////////////////////////////////////////////////
//START - TRADING RULES
direction = input(defval=1, title = "Strategy Direction",  minval=-1, maxval=1)
strategy.risk.allow_entry_in(direction == 0 ? strategy.direction.all : (direction < 0 ? strategy.direction.short : strategy.direction.long))

condition1 = close > vstop and withinTimeRange
condition2 = close < vstop and withinTimeRange

strategy.entry("BUY", strategy.long, when = condition1)
strategy.entry("SELL", strategy.short, when = condition2)

/////////////////////////////////////////////////////////////
//END - TRADING RULES

もっと