二重移動平均クロスオーバーとRSIインジケーターを組み合わせた定量取引戦略

1
Follow
1779
Followers
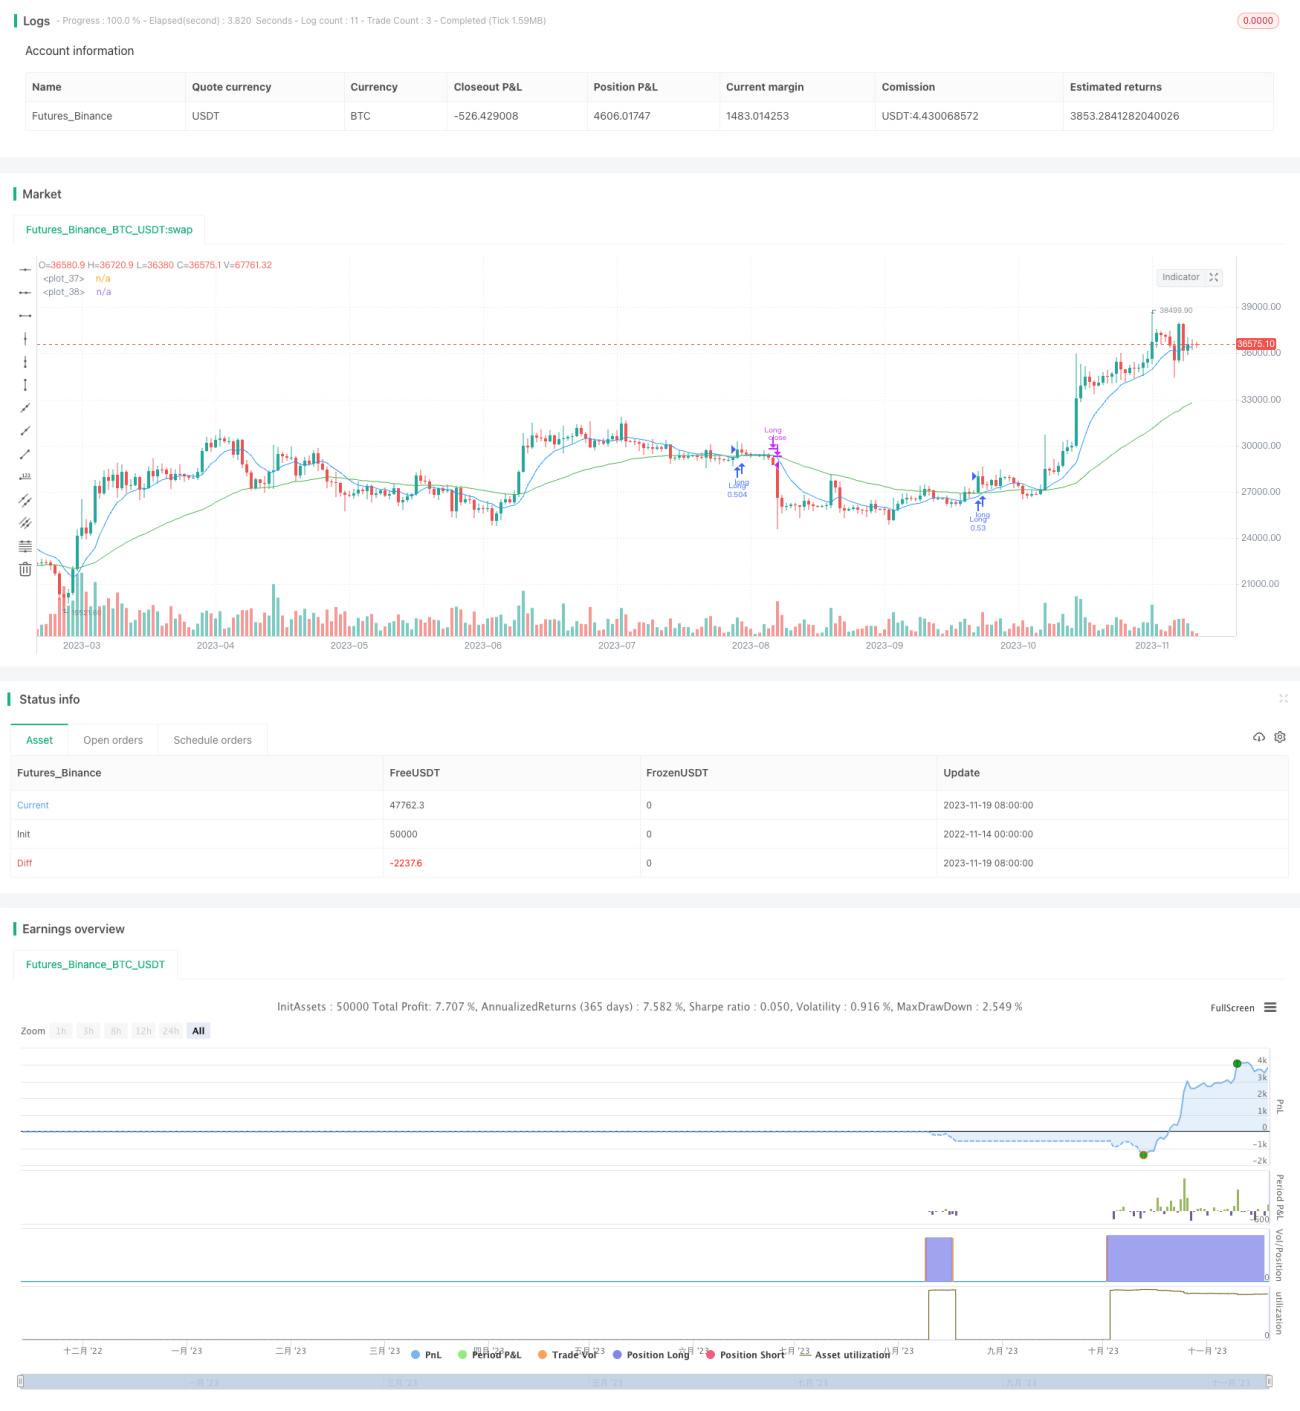
概要
この戦略は,両均線交差とRSI指標を組み合わせて,トレンドの方向を識別し,超買いと超売りの状況を超買いし,買い条件が合っているときに多めにし,売り条件が合っているときに平仓する. この戦略は,均線交差を利用してトレンドの方向を決定し,同時にRSI指標を利用して,市場のトップで多めにし,市場の底で空白を避けるようにして,より良い利益を得る.
戦略原則
速い9周期平均線でゆっくりとした50周期平均線を横切るときは,短期トレンドの上昇が長期トレンドの上昇を重ねて表示され,典型的な多頭シグナルである.また,もしRSI指標が前の周期の5点より大きく70点未満であるならば,超買い前の領域にあることを示し,このとき多頭することがより適切なタイミングである.
急速9周期平均線の下を通過すると,空頭市場であり,平仓が必要である.
優位分析
- 偽の突破を避けるために,二等線交差で大きなトレンドを判断します.
- RSIは市場転換点での誤った判断を回避する
- 均線周期を柔軟に調整し,異なる品種と時間次元に対応できます
- コントロール可能な止損策
リスク分析
- 平均線交差の意思決定は時に不効率で,損失を招く可能性があります.
- RSIのパラメータを正しく設定しない場合,ベストの入場時間を逃す可能性があります.
- 取引量が価格を支えるか 注目すべきだ
- 突発的な出来事による不合理な行動には手作業が必要である
最適化の方向
- RSIのパラメータを最適化して
- 取引量指数と組み合わせた偽信号を避ける
- 異なる品種と時間次元によるテストの最適な平均線パラメータ
- ストップ・ローズを適正に緩和し,ストップ・ローズを回避する.
要約する
この戦略は,双均線交差判定方向とRSIを回避し,上下追尾を避け,中長線トレンドを有効に利用して安定した利益を得ることができる.しかし,均線交差信号の遅滞性とRSIパラメータの調整に注意する必要もあります.価格と取引量の関係にも注意してください.継続的なテストと最適化により,この戦略は,より良い効果が得られることが期待されています.
Source
Pine
Strategy parameters
Related strategies
Comment
All comments (0)
No data
- 1