
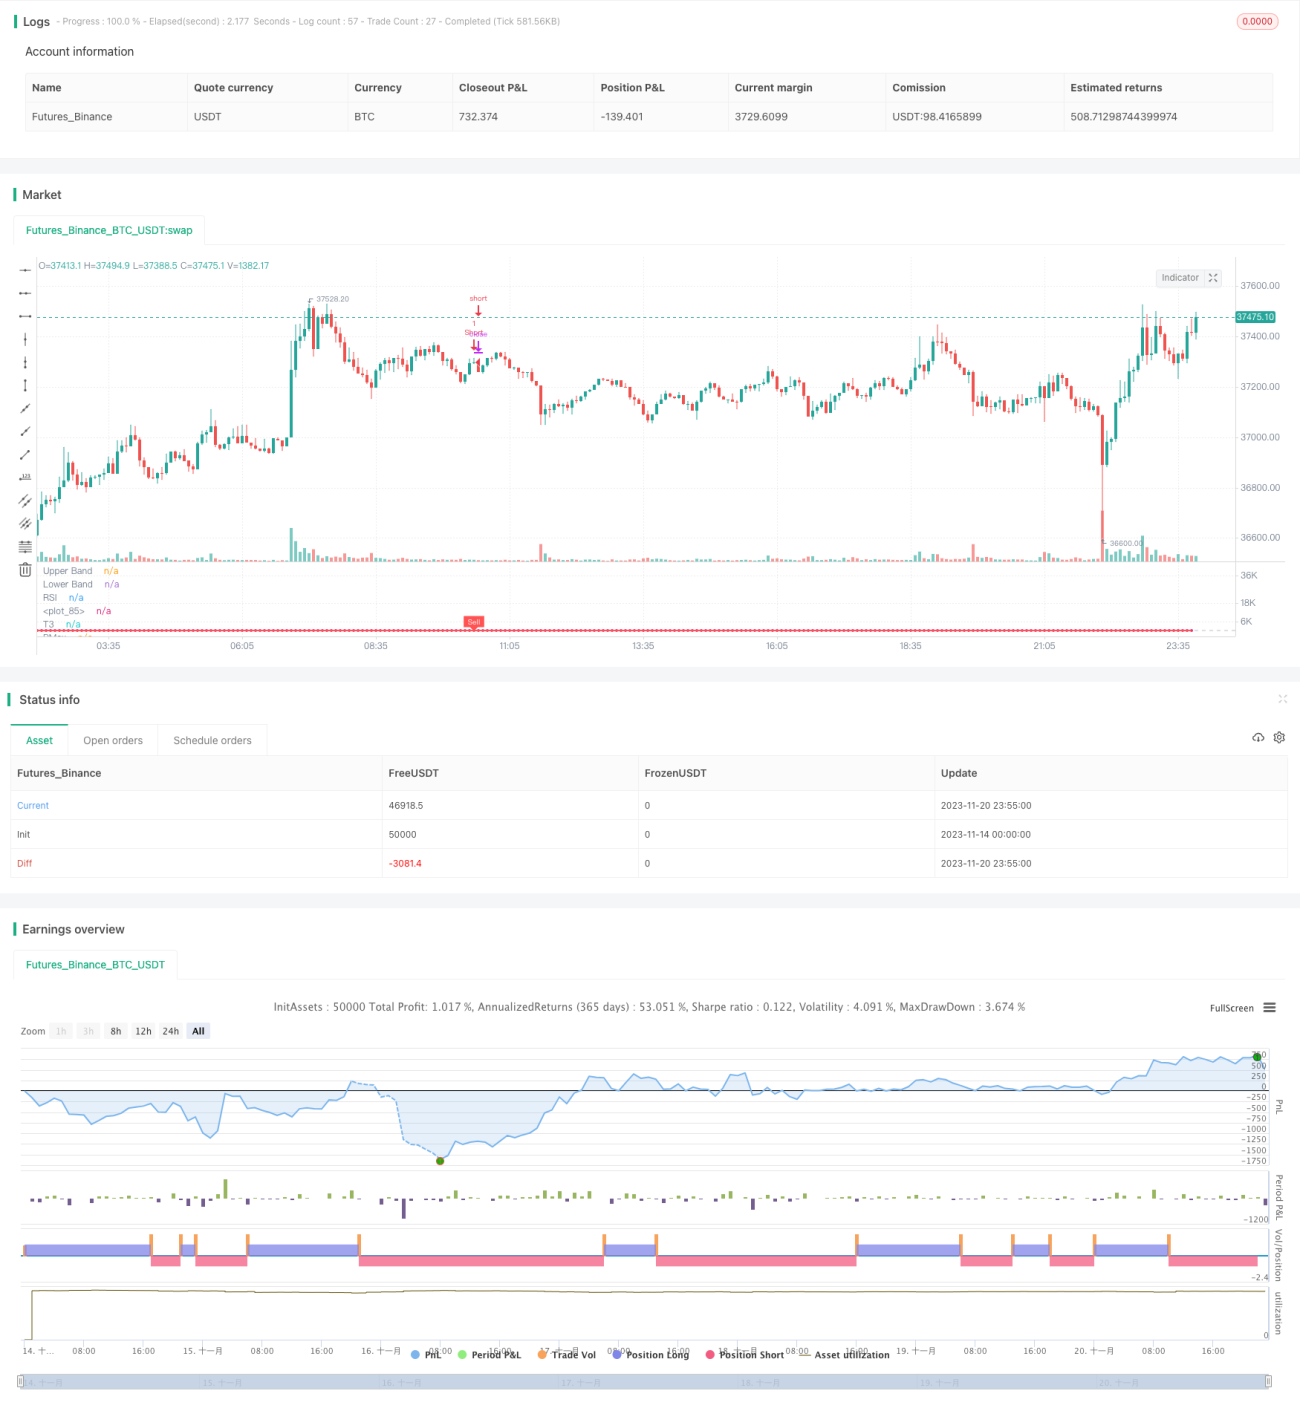
この戦略は,RSIとT3の指数を使用してトレンド判断を行い,ATRの指数と組み合わせてストップラインを設定し,PMaxを突破に適応させるための量化取引戦略である.その主な考えは,トレンド判断とストップ損失設定を最適化して,リスクを制御しながら収益性を向上させることである.
RSIとT3を計算してトレンドを決定する
ATR指数によるPMax自主ストップライン設定
突破買いと破損退出
この戦略の利点は以下の通りです.
この戦略には以下のリスクがあります.
短期間の価格逆転が起こると,ストップがトリガーされ,損失が生じることがあります. ストップラインを適切に緩めることで,反転の影響を軽減することができます.
RSIとT3指標のトレンド判断の効果は100%信頼できない.判断が間違っている場合も損失を伴う.パラメータを適切に調整したり,他の指標を加えて最適化することができる.
この戦略は,以下の点でさらに最適化できます.
この戦略は,RSI,T3およびATRの3つの指標の使用の優位性を統合し,トレンド判断とリスク管理の有機的な組み合わせを実現します.単一の指標と比較して,この組み合わせは判断精度が高く,引き下がり制御が良好な特性を有しており,信頼できるトレンド追跡戦略です.パラメータとリスク管理の面で最適化の余地があり,全体的に推奨される量化取引戦略です.
/*backtest
start: 2023-11-14 00:00:00
end: 2023-11-21 00:00:00
period: 5m
basePeriod: 1m
exchanges: [{"eid":"Futures_Binance","currency":"BTC_USDT"}]
*/
//@version=4
// This source code is subject to the terms of the Mozilla Public License 2.0 at https://mozilla.org/MPL/2.0/
// © KivancOzbilgic
//developer: @KivancOzbilgic
//author: @KivancOzbilgic
strategy("PMax on Rsi w T3 Strategy","PmR3St.", overlay=false, precision=2)
src = input(hl2, title="Source")
Multiplier = input(title="ATR Multiplier", type=input.float, step=0.1, defval=3)
length =input(8, "Tillson T3 Length", minval=1)
T3a1 = input(0.7, "TILLSON T3 Volume Factor", step=0.1)
Periods = input(10,title="ATR Length", type=input.integer)
rsilength = input(14, minval=1, title="RSI Length")
showrsi = input(title="Show RSI?", type=input.bool, defval=true)
showsupport = input(title="Show Moving Average?", type=input.bool, defval=true)
showsignalsk = input(title="Show Crossing Signals?", type=input.bool, defval=true)
highlighting = input(title="Highlighter On/Off ?", type=input.bool, defval=true)
i = close>=close[1] ? close-close[1] : 0
i2 = close<close[1] ? close[1]-close : 0
Wwma_Func(src,rsilength)=>
wwalpha = 1/ rsilength
WWMA = 0.0
WWMA := wwalpha*src + (1-wwalpha)*nz(WWMA[1])
WWMA=Wwma_Func(src,rsilength)
AvUp = Wwma_Func(i,rsilength)
AvDown = Wwma_Func(i2,rsilength)
AvgUp = sma(i,rsilength)
AvgDown =sma(i2,rsilength)
k1 = high>close[1] ? high-close[1] : 0
k2 = high<close[1] ? close[1]-high : 0
k3 = low>close[1] ? low-close[1] : 0
k4 = low<close[1] ? close[1]-low : 0
AvgUpH=(AvgUp*(rsilength-1)+ k1)/rsilength
AvgDownH=(AvgDown*(rsilength-1)+ k2)/rsilength
AvgUpL=(AvgUp*(rsilength-1)+ k3)/rsilength
AvgDownL=(AvgDown*(rsilength-1)+ k4)/rsilength
rs = AvUp/AvDown
rsi= rs==-1 ? 0 : (100-(100/(1+rs)))
rsh=AvgUpH/AvgDownH
rsih= rsh==-1 ? 0 : (100-(100/(1+rsh)))
rsl=AvgUpL/AvgDownL
rsil= rsl==-1 ? 0 : (100-(100/(1+rsl)))
TR=max(rsih-rsil,abs(rsih-rsi[1]),abs(rsil-rsi[1]))
atr=sma(TR,Periods)
plot(showrsi ? rsi : na, "RSI", color=#8E1599)
band1 = hline(70, "Upper Band", color=#C0C0C0)
band0 = hline(30, "Lower Band", color=#C0C0C0)
fill(band1, band0, color=#9915FF, transp=90, title="Background")
T3e1=ema(rsi, length)
T3e2=ema(T3e1,length)
T3e3=ema(T3e2,length)
T3e4=ema(T3e3,length)
T3e5=ema(T3e4,length)
T3e6=ema(T3e5,length)
T3c1=-T3a1*T3a1*T3a1
T3c2=3*T3a1*T3a1+3*T3a1*T3a1*T3a1
T3c3=-6*T3a1*T3a1-3*T3a1-3*T3a1*T3a1*T3a1
T3c4=1+3*T3a1+T3a1*T3a1*T3a1+3*T3a1*T3a1
T3=T3c1*T3e6+T3c2*T3e5+T3c3*T3e4+T3c4*T3e3
MAvg=T3
Pmax_Func(rsi,length)=>
longStop = MAvg - Multiplier*atr
longStopPrev = nz(longStop[1], longStop)
longStop := MAvg > longStopPrev ? max(longStop, longStopPrev) : longStop
shortStop = MAvg + Multiplier*atr
shortStopPrev = nz(shortStop[1], shortStop)
shortStop := MAvg < shortStopPrev ? min(shortStop, shortStopPrev) : shortStop
dir = 1
dir := nz(dir[1], dir)
dir := dir == -1 and MAvg > shortStopPrev ? 1 : dir == 1 and MAvg < longStopPrev ? -1 : dir
PMax = dir==1 ? longStop: shortStop
PMax=Pmax_Func(rsi,length)
plot(showsupport ? MAvg : na, color=color.black, linewidth=2, title="T3")
pALL=plot(PMax, color=color.red, linewidth=2, title="PMax", transp=0)
alertcondition(cross(MAvg, PMax), title="Cross Alert", message="PMax - Moving Avg Crossing!")
alertcondition(crossover(MAvg, PMax), title="Crossover Alarm", message="Moving Avg BUY SIGNAL!")
alertcondition(crossunder(MAvg, PMax), title="Crossunder Alarm", message="Moving Avg SELL SIGNAL!")
alertcondition(cross(src, PMax), title="Price Cross Alert", message="PMax - Price Crossing!")
alertcondition(crossover(src, PMax), title="Price Crossover Alarm", message="PRICE OVER PMax - BUY SIGNAL!")
alertcondition(crossunder(src, PMax), title="Price Crossunder Alarm", message="PRICE UNDER PMax - SELL SIGNAL!")
buySignalk = crossover(MAvg, PMax)
plotshape(buySignalk and showsignalsk ? PMax*0.995 : na, title="Buy", text="Buy", location=location.absolute, style=shape.labelup, size=size.tiny, color=color.green, textcolor=color.white, transp=0)
sellSignallk = crossunder(MAvg, PMax)
plotshape(sellSignallk and showsignalsk ? PMax*1.005 : na, title="Sell", text="Sell", location=location.absolute, style=shape.labeldown, size=size.tiny, color=color.red, textcolor=color.white, transp=0)
mPlot = plot(rsi, title="", style=plot.style_circles, linewidth=0,display=display.none)
longFillColor = highlighting ? (MAvg>PMax ? color.green : na) : na
shortFillColor = highlighting ? (MAvg<PMax ? color.red : na) : na
fill(mPlot, pALL, title="UpTrend Highligter", color=longFillColor)
fill(mPlot, pALL, title="DownTrend Highligter", color=shortFillColor)
dummy0 = input(true, title = "=Backtest Inputs=")
FromDay = input(defval = 1, title = "From Day", minval = 1, maxval = 31)
FromMonth = input(defval = 1, title = "From Month", minval = 1, maxval = 12)
FromYear = input(defval = 2005, title = "From Year", minval = 2005)
ToDay = input(defval = 1, title = "To Day", minval = 1, maxval = 31)
ToMonth = input(defval = 1, title = "To Month", minval = 1, maxval = 12)
ToYear = input(defval = 9999, title = "To Year", minval = 2006)
Start = timestamp(FromYear, FromMonth, FromDay, 00, 00)
Finish = timestamp(ToYear, ToMonth, ToDay, 23, 59)
Timerange() =>
time >= Start and time <= Finish ? true : false
if buySignalk
strategy.entry("Long", strategy.long,when=Timerange())
if sellSignallk
strategy.entry("Short", strategy.short,when=Timerange())