
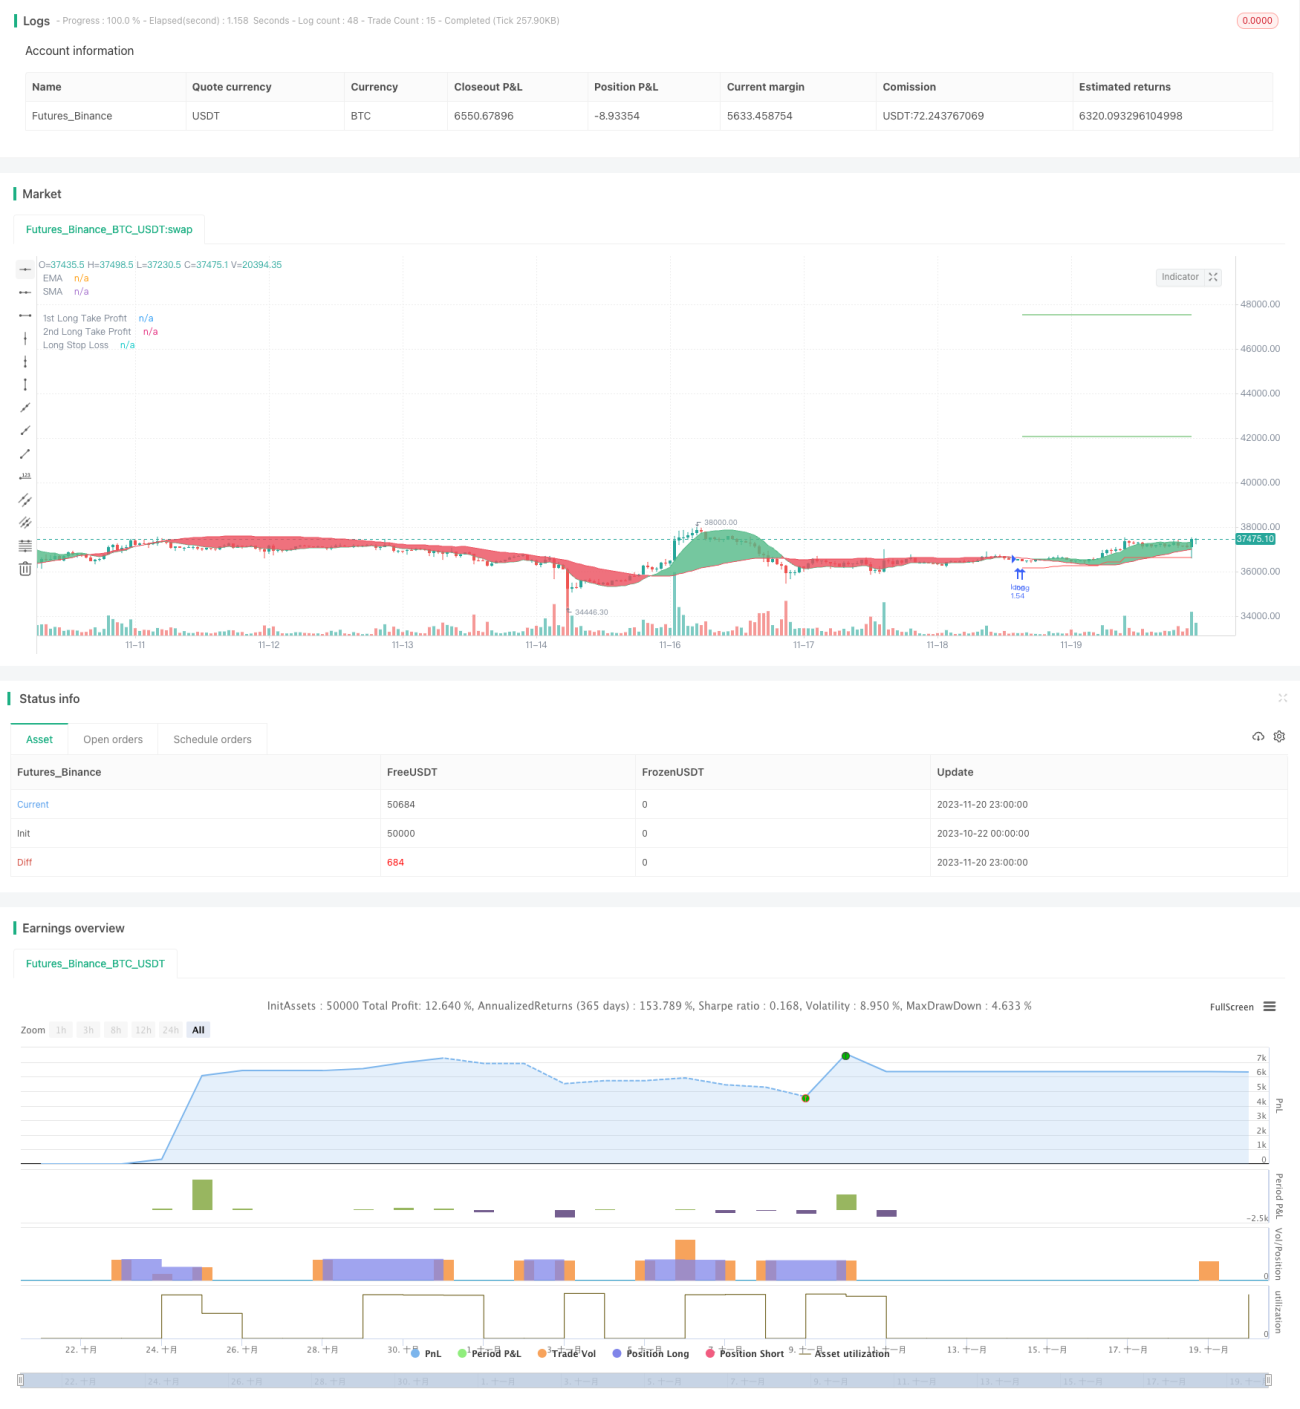
この戦略は主にBTCの長線投資を自動化するために使用されます.双EMAとLSMAの交差によってトレンドの方向性を判断し,ATR指標を使用して動的ストロスを計算し,BTCの多頭トレンドを効果的に追跡します.
25期EMAと100期LSMAを用いて二重均線を形成し,その交差は市場トレンドを判断するために使用される.
急速なEMAが緩慢なLSMAを通過すると,まだ多頭トレンドにあると判断されるときは,多頭する.逆に,急速なEMAが緩慢なLSMAを通過すると空頭に入ると判断され,平仓する.
入札後,ATR指標を用いた動的ストップロスは継続的に調整され,BTCの上昇傾向を効果的に追跡することができる.具体的には,ストップラインの初期ポイントは入札価格であり,その後,毎回の調整は固定比率のATR幅を上滑させる.
ストップラインは,BTCの上昇による浮動を効果的にロックし,最新の価格にあまりにも近いストップポイントを頻繁にストップすることを防ぐことができます. さらに,戦略は,より多くの利益をロックするために,2つの異なる割合の移動ストップを設定します.
双均線を用いた傾向判断はより信頼性が高く,偽信号の発生を効果的に防ぐことができる.
ATRのダイナミック・トラッキング・ストップは,利益のほとんどをロックするだけでなく,小規模なストップを頻繁に回避することもできます.
多頭取引が終了したかどうかは別として,均線が退出信号を発した時点で,結末は停止し,リスクは制御される.
自動化が高度で,人工の介入も不要で,長時間稼働が可能です.
ニュースで大きな突発を避けるために,大きな損失を避けるために注意が必要です.
双均線結合は偽信号を減少させるが,震動の状況では完全に回避することは困難である.
ATRパラメータの設定が不適切であることも,止損効果に影響し,異なる品種に応じて調整する必要がある.
平均線周期が合理的でないか,時間通りに更新されないことも信号の遅延の原因となる.
サーバーの安定性を確保し,自動取引の停止を引き起こす異常な停止を回避する.
ブリン帯など,より多くの指標でトレンドを判断したり,機械学習モデルを使って価格を予測したりできます.
ATRダイナミックストロップの計算方法も調整して最適化して,ストロップをより滑らかにすることができる.
取引量や日中の輪廻のFEATUREによるアラームメカニズムが追加され,重大ニュース面の衝撃を防ぎます.
各通貨のパラメータは異なるので,より多くの歴史データを使用して個別化パラメータを訓練できます.
この戦略は,全体的に非常に実用的なBTC自動投資プログラムである. 二重EMAを使用して大きなトレンドを判断することは非常に信頼性があり,ATRのストップロスを追跡することで,良い利益を得ることができ,有効期間も長い. パラメータの継続的な最適化調整とともに,この戦略の効果は,向上する余地があり,実験的に検証する価値があります.
// This source code is subject to the terms of the Mozilla Public License 2.0 at https://mozilla.org/MPL/2.0/
// © Wunderbit Trading
//@version=4
strategy("Automated Bitcoin (BTC) Investment Strategy", overlay=true, initial_capital=5000,pyramiding = 0, currency="USD", default_qty_type=strategy.percent_of_equity, default_qty_value=100, commission_type=strategy.commission.percent,commission_value=0.1)
//////////// Functions
Atr(p) =>
atr = 0.
Tr = max(high - low, max(abs(high - close[1]), abs(low - close[1])))
atr := nz(atr[1] + (Tr - atr[1])/p,Tr)
//TEMA
TEMA(series, length) =>
if (length > 0)
ema1 = ema(series, length)
ema2 = ema(ema1, length)
ema3 = ema(ema2, length)
(3 * ema1) - (3 * ema2) + ema3
else
na
tradeType = input("LONG", title="What trades should be taken : ", options=["LONG", "SHORT", "BOTH", "NONE"])
///////////////////////////////////////////////////
/// INDICATORS
source=close
/// TREND
trend_type1 = input("TEMA", title ="First Trend Line : ", options=["LSMA", "TEMA","EMA","SMA"])
trend_type2 = input("LSMA", title ="First Trend Line : ", options=["LSMA", "TEMA","EMA","SMA"])
trend_type1_length=input(25, "Length of the First Trend Line")
trend_type2_length=input(100, "Length of the Second Trend Line")
leadLine1 = if trend_type1=="LSMA"
linreg(close, trend_type1_length, 0)
else if trend_type1=="TEMA"
TEMA(close,trend_type1_length)
else if trend_type1 =="EMA"
ema(close,trend_type1_length)
else
sma(close,trend_type1_length)
leadLine2 = if trend_type2=="LSMA"
linreg(close, trend_type2_length, 0)
else if trend_type2=="TEMA"
TEMA(close,trend_type2_length)
else if trend_type2 =="EMA"
ema(close,trend_type2_length)
else
sma(close,trend_type2_length)
p3 = plot(leadLine1, color= #53b987, title="EMA", transp = 50, linewidth = 1)
p4 = plot(leadLine2, color= #eb4d5c, title="SMA", transp = 50, linewidth = 1)
fill(p3, p4, transp = 60, color = leadLine1 > leadLine2 ? #53b987 : #eb4d5c)
//Upward Trend
UT=crossover(leadLine1,leadLine2)
DT=crossunder(leadLine1,leadLine2)
// TP/ SL/ FOR LONG
// TAKE PROFIT AND STOP LOSS
long_tp1_inp = input(15, title='Long Take Profit 1 %', step=0.1)/100
long_tp1_qty = input(20, title="Long Take Profit 1 Qty", step=1)
long_tp2_inp = input(30, title='Long Take Profit 2%', step=0.1)/100
long_tp2_qty = input(20, title="Long Take Profit 2 Qty", step=1)
long_take_level_1 = strategy.position_avg_price * (1 + long_tp1_inp)
long_take_level_2 = strategy.position_avg_price * (1 + long_tp2_inp)
long_sl_input = input(5, title='stop loss in %', step=0.1)/100
long_sl_input_level = strategy.position_avg_price * (1 - long_sl_input)
// Stop Loss
multiplier = input(3.5, "SL Mutiplier", minval=1, step=0.1)
ATR_period=input(8,"ATR period", minval=1, step=1)
// Strategy
//LONG STRATEGY CONDITION
SC = input(close, "Source", input.source)
SL1 = multiplier * Atr(ATR_period) // Stop Loss
Trail1 = 0.0
Trail1 := iff(SC < nz(Trail1[1], 0) and SC[1] < nz(Trail1[1], 0), min(nz(Trail1[1], 0), SC + SL1), iff(SC > nz(Trail1[1], 0), SC - SL1, SC + SL1))
Trail1_high=highest(Trail1,50)
// iff(SC > nz(Trail1[1], 0) and SC[1] > nz(Trail1[1], 0), max(nz(Trail1[1], 0), SC - SL1),
entry_long=crossover(leadLine1,leadLine2) and Trail1_high < close
exit_long = close < Trail1_high or crossover(leadLine2,leadLine1) or close < long_sl_input_level
///// BACKTEST PERIOD ///////
testStartYear = input(2016, "Backtest Start Year")
testStartMonth = input(1, "Backtest Start Month")
testStartDay = input(1, "Backtest Start Day")
testPeriodStart = timestamp(testStartYear, testStartMonth, testStartDay, 0, 0)
testStopYear = input(9999, "Backtest Stop Year")
testStopMonth = input(12, "Backtest Stop Month")
testStopDay = input(31, "Backtest Stop Day")
testPeriodStop = timestamp(testStopYear, testStopMonth, testStopDay, 0, 0)
testPeriod() =>
time >= testPeriodStart and time <= testPeriodStop ? true : false
if testPeriod()
if tradeType=="LONG" or tradeType=="BOTH"
if strategy.position_size == 0 or strategy.position_size > 0
strategy.entry("long", strategy.long, comment="b8f60da7_ENTER-LONG_BINANCE_BTC/USDT_b8f60da7-BTC-Investment_4H", when=entry_long)
strategy.exit("TP1", "long", qty_percent=long_tp1_qty, limit=long_take_level_1)
strategy.exit("TP2", "long", qty_percent=long_tp2_qty, limit=long_take_level_2)
strategy.close("long", when=exit_long, comment="b8f60da7_EXIT-LONG_BINANCE_BTC/USDT_b8f60da7-BTC-Investment_4H" )
// LONG POSITION
plot(strategy.position_size > 0 ? long_take_level_1 : na, style=plot.style_linebr, color=color.green, linewidth=1, title="1st Long Take Profit")
plot(strategy.position_size > 0 ? long_take_level_2 : na, style=plot.style_linebr, color=color.green, linewidth=1, title="2nd Long Take Profit")
plot(strategy.position_size > 0 ? Trail1_high : na, style=plot.style_linebr, color=color.red, linewidth=1, title="Long Stop Loss")