デュアルトラックシステムモメンタムトレーディング戦略

[trans]
概要
この戦略は,MACDとStoch RSIの2種類の指標を組み合わせて,二線取引システムを構築し,トレンドを追跡し,超跌超買い判断を実現します.戦略は,日線と4時間線の両方で指標を構築し,複数の時間枠の判断を実現し,誤判の可能性を減らす.
戦略原則
戦略のポートフォリオは,MACDとStoch RSIの2つの異なるタイプの技術指標を使用し,配置します. MACDは差動指標であり,価格の変化の速度を判断します.
戦略は,まず日線と4時間線でそれぞれMACDとStoch RSIの指標を構築し,トレンドと超買超売の判断を行う.
具体的には,MACD指標を構成し,DIF線とDEA線を金叉死叉として判断する.Stoch RSI指標を構成し,K線とD線を金叉死叉として判断する.
このように,戦略は,双線指標と複数の時間枠の判断を総合的に使用し,価格の変化速度と相対的な強さの全面的な判断を行うことで,意思決定の正確性を向上させ,より良いリターンを獲得するのに役立ちます.
優位分析
この戦略には以下の利点があります.
- 双線指標を組み合わせて,全体的な判断を行い,意思決定の正確性を向上させる
- 複数のタイムフレームを用いることで 誤判の可能性を減らす
- トレンド追跡と超買超売判断を用いて,価格変動の速度と相対的な弱さを総合的に考慮する
- 指標のパラメータは,異なる品種と市場環境に対応して調整できます
- コード構造は明確で,理解しやすく,拡張しやすい.
リスク分析
この戦略にはいくつかのリスクがあります.
- 市場にはシステムリスクがあり,完全に回避できない
- 指数パラメータの不適切な設定は,取引の頻度や機会の逃れにつながる可能性があります.
- 双線指標が同時に誤信号を発する確率は存在するが,単線指標より低い
- 市場が急激に変化する際には対応できず,例えば大きな黒天<unk>事件などに
対策として
- パラメータを最適化し,取引条件を調整し,誤判を減らす
- 複数の指標を組み合わせて判断力を高める
- 損失を抑える戦略を高め,単発損失のリスクを抑えること
最適化の方向
この戦略は,以下の点で改善できます.
- 複数の指標を組み合わせ,多指標戦略を策定する
- 機械学習アルゴリズムを追加し,動態パラメータ最適化を実現する.
- 市場情勢を判断する他の要因は,感情指標やニュース面などです.
- ストップ・ロスト・ストップ・ストップ・ストラテジーを増やし,資金管理を最適化
- 取引の種類を拡大し,より良い取引機会を模索
要約する
この戦略は,双線指標と複数の時間枠判断の組み合わせを使用し,価格変化の速度と相対的な強さを全面的に判断し,市場動向を効果的に取得し,単一の指標の誤判の欠陥を改善することができます.また,パラメータ調整の柔軟性,理解しやすく拡張するなどの利点があります.その後,複数の指標の組み合わせ,動的パラメータ最適化,感情指標の導入などの方法で拡張および最適化され,戦略のパフォーマンスをさらに向上させることができます.
||
Overview
This strategy combines the MACD and Stoch RSI indicators to build a dual-rail trading system for trend tracking and oversold/overbought judgment. The strategy also builds indicators on the daily and 4-hour timeframes to make multi-timeframe judgments to reduce misjudgment probability.
Strategy Principle
The strategy combines the MACD and Stoch RSI indicators, which are different types of technical indicators, for configuration. MACD is a momentum indicator that judges price change velocity; Stoch RSI is an overbought/oversold indicator that judges relative price strength.
The strategy first constructs the MACD and Stoch RSI indicators on the daily and 4-hour timeframes respectively for trend and overbought/oversold judgments. When signals are triggered on both timeframes, corresponding buy/sell operations are performed.
Specifically, the MACD indicator is constructed with the DIF and DEA lines forming golden/dead crosses for judgment; the Stoch RSI indicator is constructed with the K and D lines forming golden/dead crosses for judgment. When both indicator pairs have golden crosses, buy signals are generated; when both have dead crosses, sell signals are generated.
Thus, by comprehensively applying the dual-indicator system and multi-timeframe judgments, the strategy judges price velocity and relative strength thoroughly, which helps improve decision accuracy and gain better returns.
Advantage Analysis
This strategy has the following advantages:
- Combining dual-indicator system for comprehensive judgment and higher decision accuracy
- Applying multi-timeframe to reduce misjudgment probability
- Adopting trend tracking and overbought/oversold judgment for consideration of both price velocity and relative strength
- Flexible indicator parameters adjustable for different products and market environments
- Clean code structure easy to understand and expand
Risk Analysis
There are also some risks with this strategy:
- There exist systemic market risks that cannot be fully avoided
- Inappropriate indicator parameter settings may lead to overtrading or missing opportunities
- Dual indicators may still give concurrent wrong signals, but less likely than single ones
- Unable to cope with drastic market changes like black swan events
Countermeasures:
- Optimize parameters and adjust trading conditions to reduce misjudgments
- Incorporate more indicators for combined judgments
- Add stop loss mechanisms to control single loss risk
Optimization Directions
This strategy can also be improved in the following aspects:
- Incorporate more indicators for multi-indicator strategies
- Add machine learning algorithms for dynamic parameter optimization
- Combine sentiment indicators, news etc. for more comprehensive market condition judgments
- Add stop loss, take profit strategies to optimize money management
- Expand to more trading products to discover better opportunities
Conclusion
By combined application of the dual-indicator system and multi-timeframe judgments, this strategy judges price velocity and relative strength thoroughly, which can effectively capture market trends and improve deficiencies of single indicators. It also has advantages like flexible parameter tuning, easy understanding and expansion. Further expansions by multi-indicator combination, dynamic parameter optimization, sentiment indicator incorporation etc. can help boost strategy performance.
[trans]
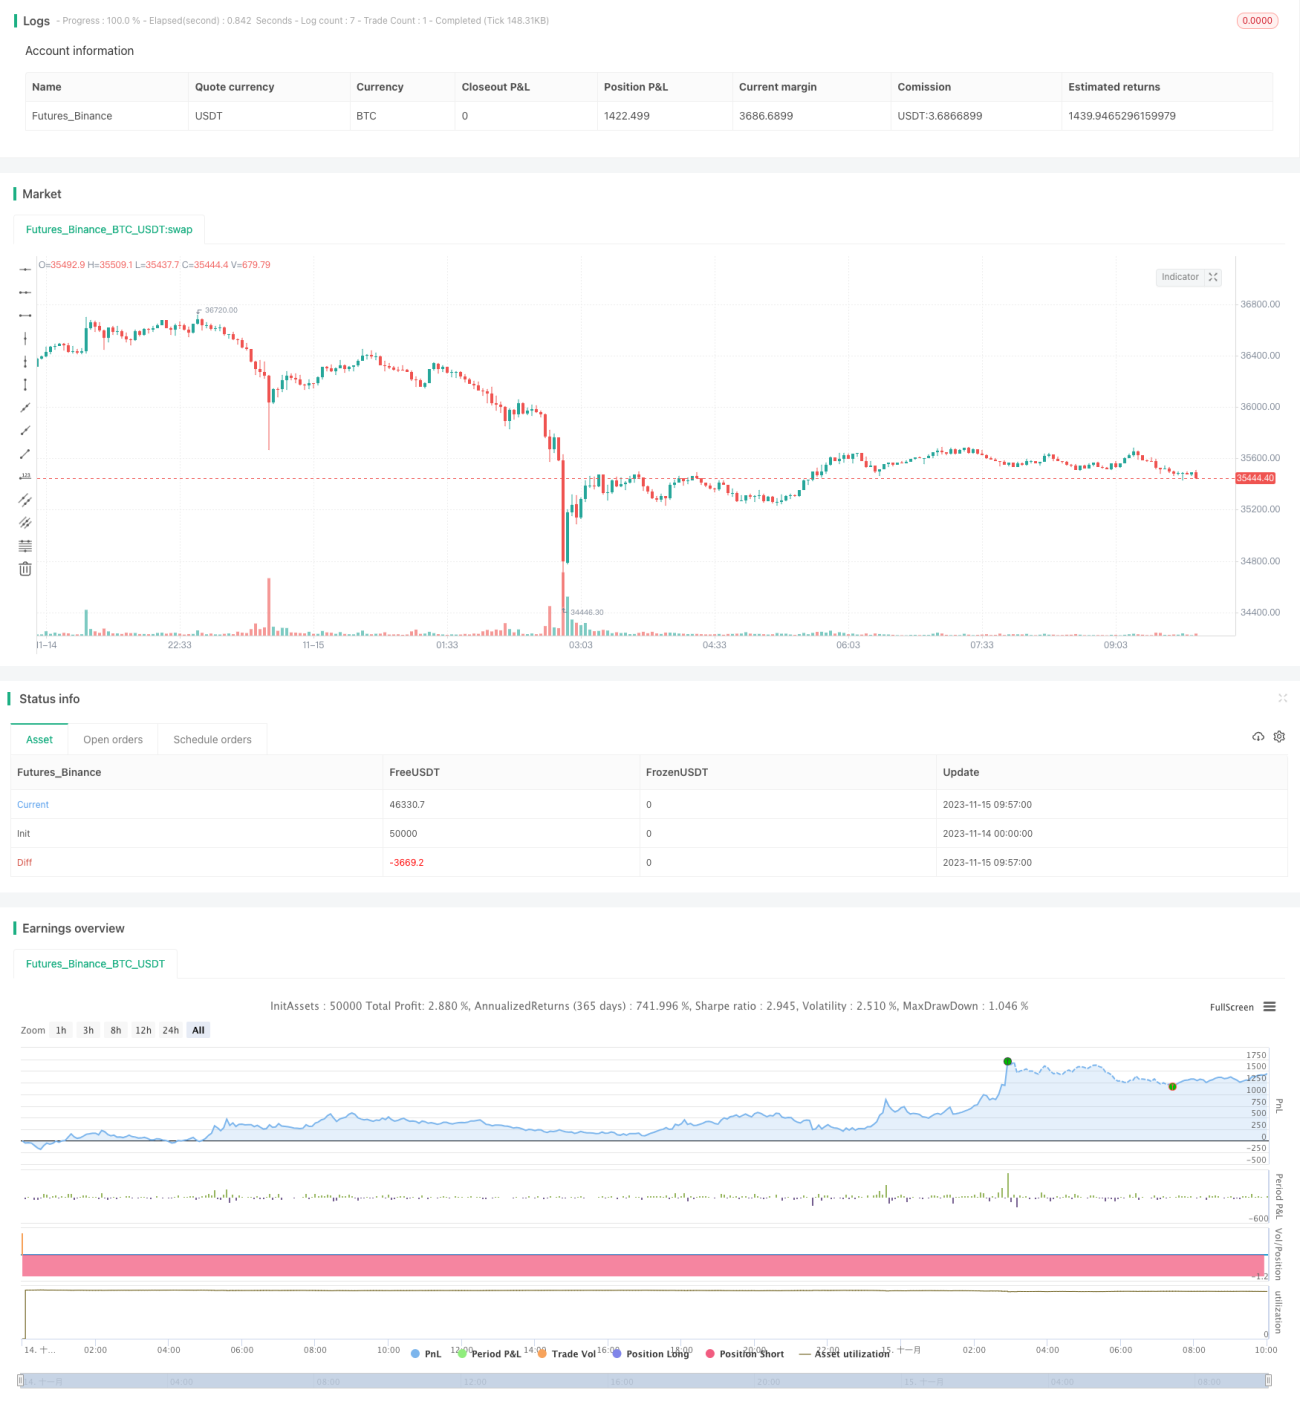
/*backtest
start: 2023-11-14 00:00:00
end: 2023-11-15 10:00:00
period: 3m
basePeriod: 1m
exchanges: [{"eid":"Futures_Binance","currency":"BTC_USDT"}]
*/

//@version=2
strategy(title='[RS]Khizon (UWTI) Strategy V0', shorttitle='K', overlay=false, pyramiding=0, initial_capital=100000, currency=currency.USD)
//  ||  Inputs:
macd_src = input(title='MACD Source:', defval=close)- 1