高速移動平均と低速移動平均のクロスオーバー戦略に基づく

1
Follow
1779
Followers
概要
移動平均線交差戦略は,移動平均線をベースにしたシンプルで効果的な量的な取引戦略である.この戦略は,高速移動平均線と遅い移動平均線の交差を買入と売却の信号として利用する.高速線が下方から遅い線を突破すると,買入の信号が生じ,高速線が上方から下方から遅い線を突破すると,売却の信号が生じます.
戦略原則
この戦略の核心的な論理は,市場動向を判断するために移動平均を利用することです.移動平均は,それ自体が,乱流のランダムな市場騒音の機能を持っています.急速な移動平均は,最新のトレンドを反映して,価格の変化により迅速に反応します.ゆっくりとした移動平均は,最新の価格変化に反応し,中長期のトレンドを表します.
具体的には,この戦略は,まず速動平均線sig1と遅動平均線sig2を定義し,それからsig1とsig2の交差関係に基づいて買賣点を判断する.sig1が下からsig2を突破すると買買のシグナルlongConditionが生じ,sig1が上から下からsig2を突破すると売売のシグナルshortConditionが生じます.この戦略は,次に,購入と売却の条件を満たした注文を設定し,ストップ・ロズとストップ・アウト・オーダーを設定する.
優位分析
この戦略の利点は明らかです.
- シンプルで理解し,実行しやすい論理
- パラメータ調整の柔軟性,異なる市場条件に合わせて調整可能
- 他の指標のフィルター信号と組み合わせて安定性を向上させる
- EURCHF 日線データでは,EMA15-EMA30の組み合わせが83%の勝利率を誇る
リスク分析
この戦略にはリスクもあります.
- ワイプソー効果は深刻で,止損設定は重要
- 大震災は悪影響を与えた
- 異なる品種と周期に適応するために再テストの調配が必要である
改善策として:
- 判断の他の指標を追加し,ウィップソーを避ける
- 移動平均の種類とパラメータを異なる品種に適応させる
- ストップ・ストップ比率を最適化し,リスクを制御する
要約する
移動平均線交差戦略は,全体として,論理的にシンプルで実用的な量化戦略である.パラメータ調整と適切な最適化により,さまざまな市場環境で安定した利益を上げることができる.量化トレーダーの重点研究と適用に値する.
Source
Pine
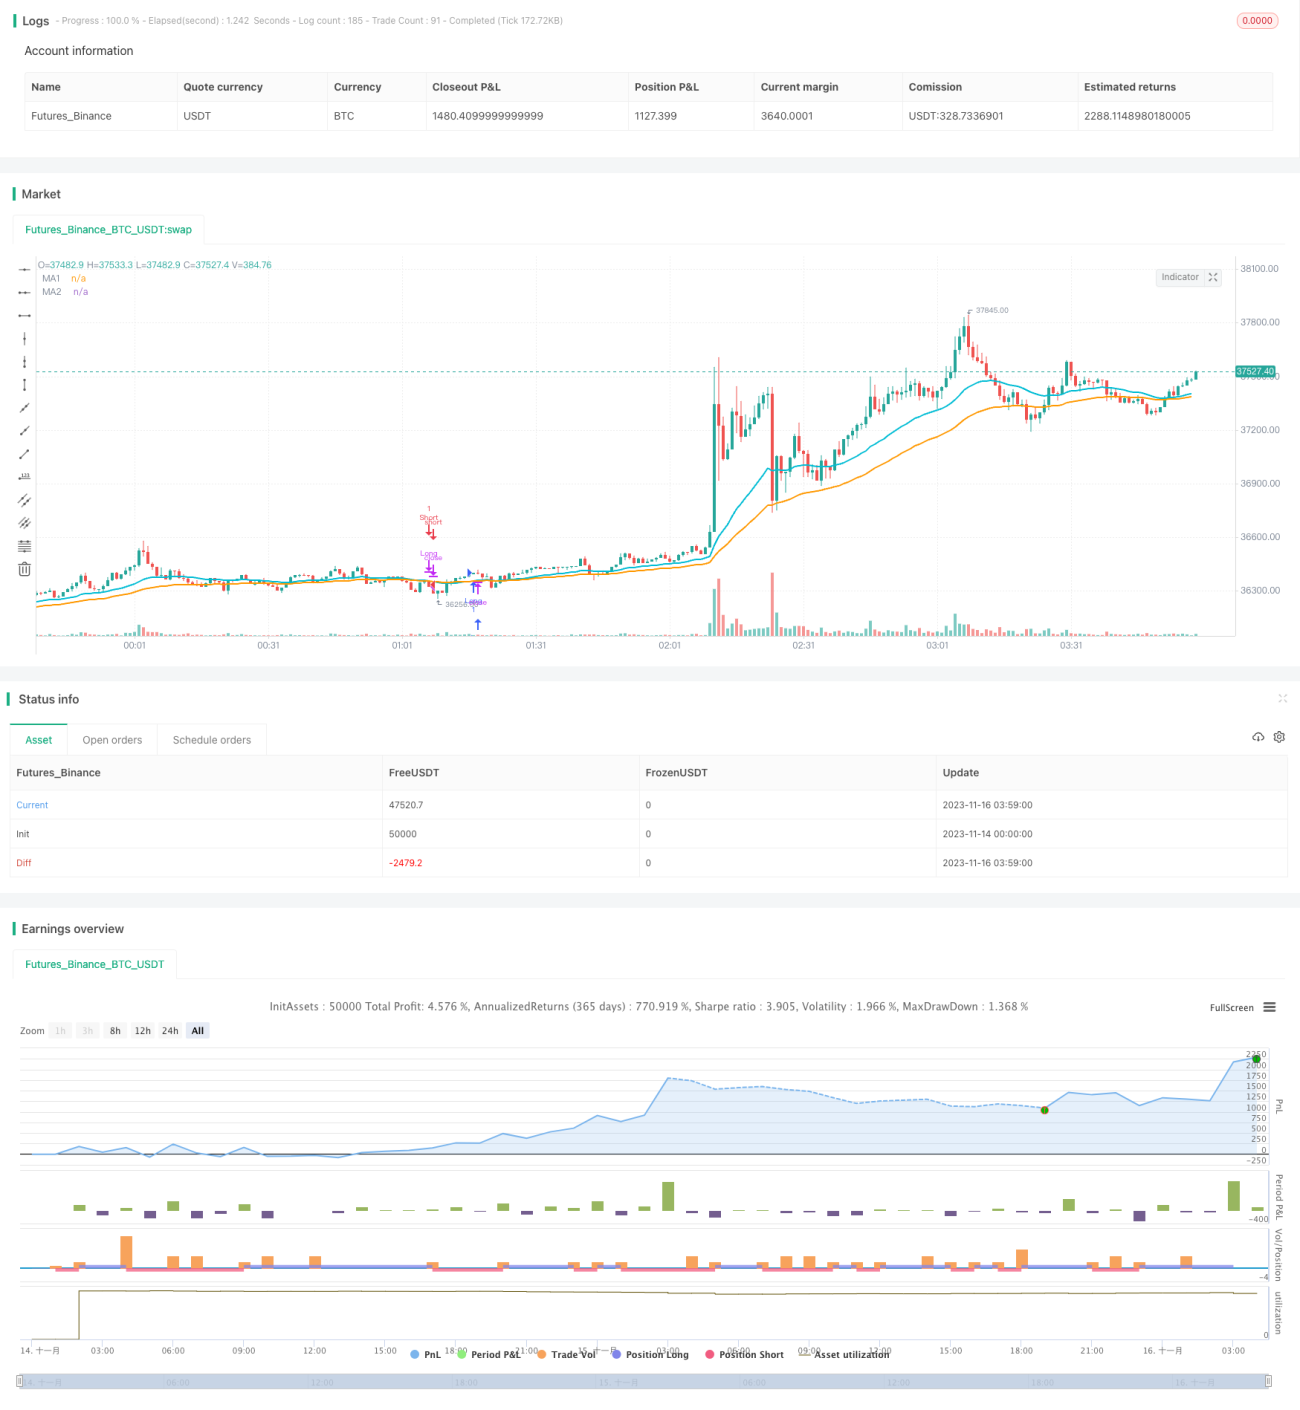
/*backtest
start: 2023-11-14 00:00:00
end: 2023-11-16 04:00:00
period: 1m
basePeriod: 1m
exchanges: [{"eid":"Futures_Binance","currency":"BTC_USDT"}]
*/

//@version=3
// Simple yet effective MA cross strategy.
// You'll have to tune the parameters to get an optimal win ratio.
// If JPY or XAU or any other currency with pips defined as the Strategy parameters
Related strategies
Comment
All comments (0)
No data
- 1