
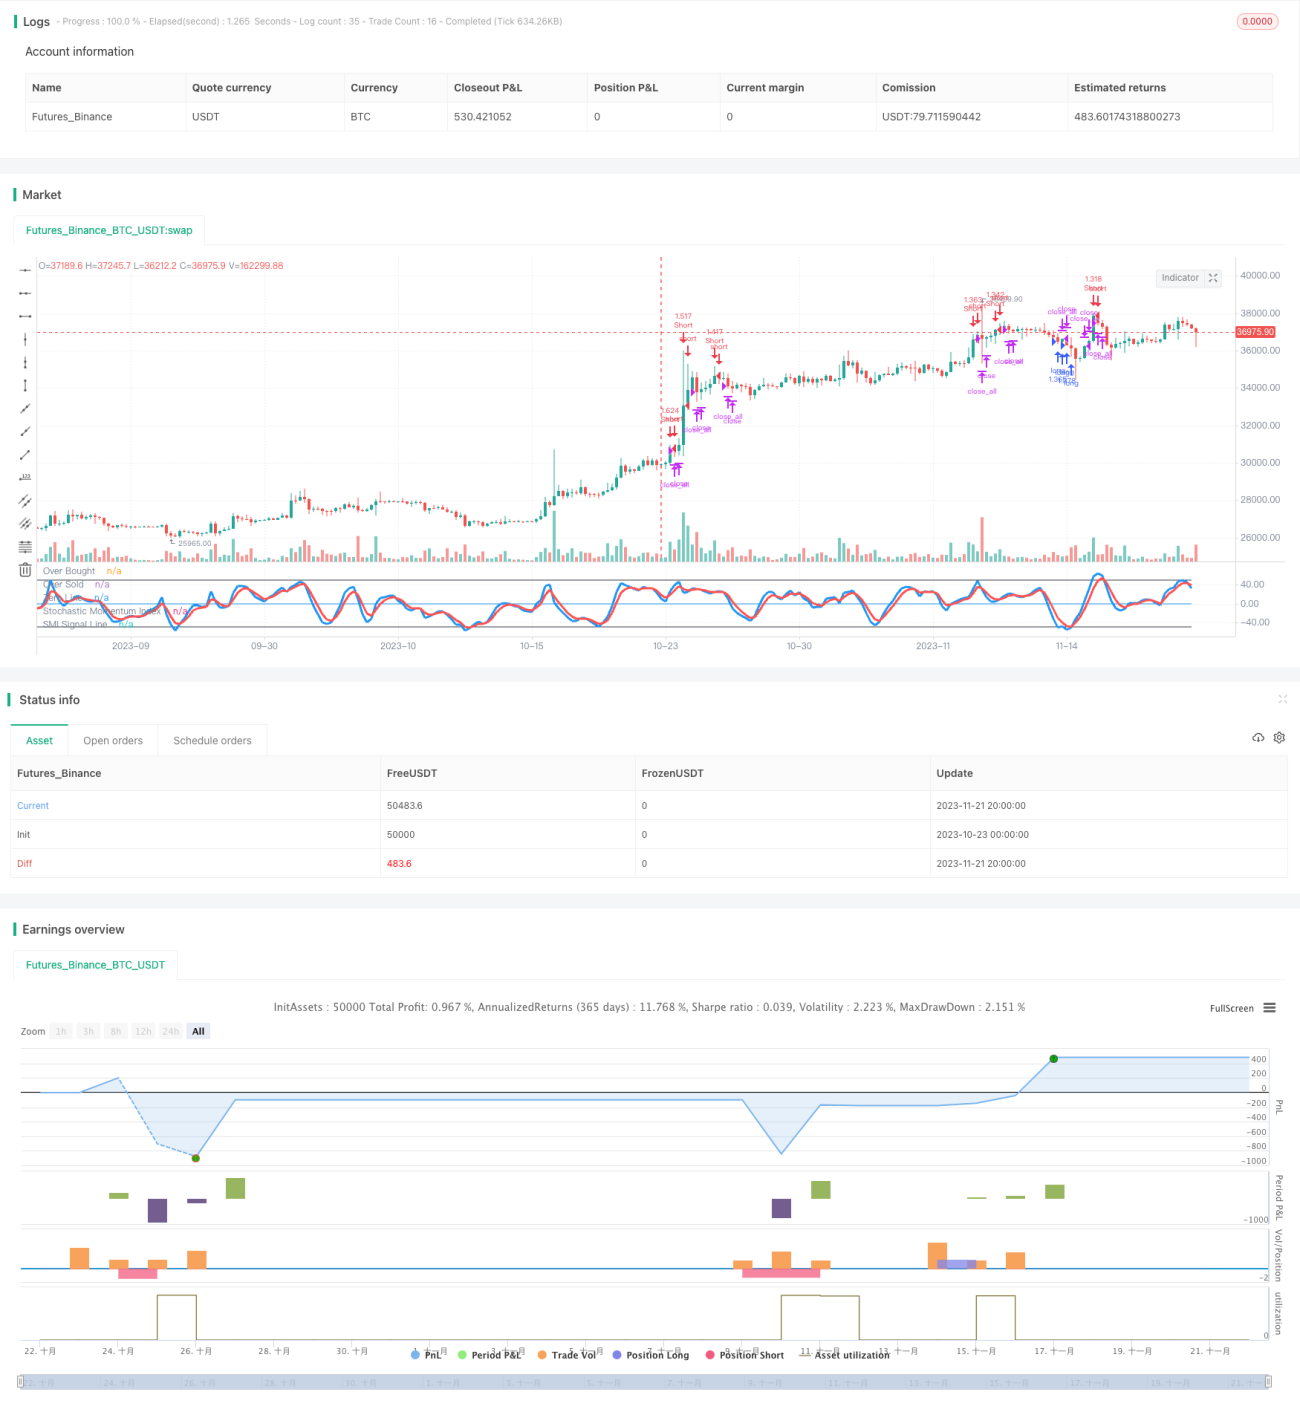
これは,動力指数とK線実体フィルタを組み合わせた個別化取引戦略である. それは,ランダムな動力指数,急速なRSI,K線実体フィルタを3つの技術指標を総合的に使用し,動力突破を主として実現し,同時に,超買超売を考慮する戦略である.
この戦略では,以下の3つの指標を用いて取引シグナルを判断します.
ランダム運動指数 ((SMI):K線実体間隔と閉盘価格の相対的な位置を組み合わせて,価格動力が強いことを判断する.SMI上の境界線を横切るときは買入シグナルを生じ,下側の境界線を横切るときは売出シグナルを生成する.
急速RSI ((7日線):価格の超買超売状態を判断する。RSIは20を下回ると超売に買入シグナルを生じ,80を超えると超買に売り出そうシグナルを生じ。
K線実体フィルター: 10日間の平均K線実体サイズを計算し,今日のK線実体がその平均値の1/3を超えると有効で,無効信号を回避する.
この戦略は,SMIとRSIの信号を判断し,そのいずれかの指標の信号要件を満たす場合は,K線実体フィルターと組み合わせて,その信号が有効かどうかを判断し,有効であれば取引信号を生成します.
この戦略は以下の利点があります.
複数の指標を組み合わせると,判断はより正確で信頼性が高くなります.
K線実体フィルターを追加し,無効信号を回避する.
超買いと超売りの判断を組み合わせると,トレンドの逆転の時に信号を捉えるのが容易になります.
取引を2方向に広げることで,利益を得る機会が増加する.
単一取引で過度の損失を避けるため,部分取引ポジションを採用する.
この戦略にはいくつかのリスクがあります.
指数の作用下では,誤信号が発生しやすいため,損失が発生する.パラメータを最適化することで誤信号を減らすことができる.
各方向のトレンドの機会を充分に利用できない部分のポジション取引. 取引ポジションを拡大することでより高い収益を得ることができる.
SMIは主指数として,パラメータ設定に敏感であり,不適切な設定により取引機会が逃れ,または誤信号が増加する可能性があります.
多空双方向取引,頻繁な操作,取引コストの増加.
この戦略は,以下の方向からさらに改善できます.
SMIとRSIのパラメータを最適化して,最適なパラメータの組み合わせを見つけます.
ポジションの拡大とポジション管理の仕組みを増やすことで,トレンドの中でより高い収益を得ることができます.
単発損失のリスクを減らすために,損失を止める戦略を増やす.
信号の信頼性を判断するインディケーターが増え,誤信号が減少する.
効率的な契約を導入し,取引コストを削減します.
この戦略は,SMI,急速RSI,K線実体フィルタリングの3つの技術指標を総合的に使用し,超買超売を兼ね備えた動力主体の個別化取引戦略を実現する. それは,判断精度,有効な信号の識別,超買超売と多空取引の組み合わせなどの優位性を有し,いくつかのパラメータの感受性,トレンドの充分な利用ができない,操作の頻度などのリスクもある. パーメータ設定を継続的に最適化し,ポジションと止損管理を増やし,誤信号を減らす方法によって,この戦略は,より良い取引効果を得ることができる.
/*backtest
start: 2023-10-23 00:00:00
end: 2023-11-22 00:00:00
period: 6h
basePeriod: 15m
exchanges: [{"eid":"Futures_Binance","currency":"BTC_USDT"}]
*/
//Noro
//2018
//@version=2
strategy(title = "Noro's Stochastic Strategy v1.2", shorttitle = "Stochastic str 1.2", overlay = false, default_qty_type = strategy.percent_of_equity, default_qty_value = 100, pyramiding = 0)
//Settings
needlong = input(true, defval = true, title = "Long")
needshort = input(true, defval = true, title = "Short")
usemar = input(false, defval = false, title = "Use Martingale")
capital = input(100, defval = 100, minval = 1, maxval = 10000, title = "Capital, %")
usesmi = input(true, defval = true, title = "Use SMI Strategy")
usersi = input(true, defval = true, title = "Use RSI Strategy")
usebod = input(true, defval = true, title = "Use Body-Filter")
a = input(5, "SMI Percent K Length")
b = input(3, "SMI Percent D Length")
limit = input(50, defval = 50, minval = 1, maxval = 100, title = "SMI Limit")
fromyear = input(2017, defval = 2017, minval = 1900, maxval = 2100, title = "From Year")
toyear = input(2100, defval = 2100, minval = 1900, maxval = 2100, title = "To Year")
frommonth = input(01, defval = 01, minval = 01, maxval = 12, title = "From Month")
tomonth = input(12, defval = 12, minval = 01, maxval = 12, title = "To Month")
fromday = input(01, defval = 01, minval = 01, maxval = 31, title = "From day")
today = input(31, defval = 31, minval = 01, maxval = 31, title = "To day")
//Fast RSI
fastup = rma(max(change(close), 0), 7)
fastdown = rma(-min(change(close), 0), 7)
fastrsi = fastdown == 0 ? 100 : fastup == 0 ? 0 : 100 - (100 / (1 + fastup / fastdown))
//Stochastic Momentum Index
ll = lowest (low, a)
hh = highest (high, a)
diff = hh - ll
rdiff = close - (hh+ll)/2
avgrel = ema(ema(rdiff,b),b)
avgdiff = ema(ema(diff,b),b)
SMI = avgdiff != 0 ? (avgrel/(avgdiff/2)*100) : 0
SMIsignal = ema(SMI,b)
//Lines
plot(SMI, color = blue, linewidth = 3, title = "Stochastic Momentum Index")
plot(SMIsignal, color = red, linewidth = 3, title = "SMI Signal Line")
plot(limit, color = black, title = "Over Bought")
plot(-1 * limit, color = black, title = "Over Sold")
plot(0, color = blue, title = "Zero Line")
//Body Filter
nbody = abs(close - open)
abody = sma(nbody, 10)
body = nbody > abody / 3 or usebod == false
//Signals
up1 = SMI < -1 * limit and close < open and body and usesmi
dn1 = SMI > limit and close > open and body and usesmi
up2 = fastrsi < 20 and close < open and body and usersi
dn2 = fastrsi > 80 and close > open and body and usersi
exit = ((strategy.position_size > 0 and close > open) or (strategy.position_size < 0 and close < open)) and body
//Trading
profit = exit ? ((strategy.position_size > 0 and close > strategy.position_avg_price) or (strategy.position_size < 0 and close < strategy.position_avg_price)) ? 1 : -1 : profit[1]
mult = usemar ? exit ? profit == -1 ? mult[1] * 2 : 1 : mult[1] : 1
lot = strategy.position_size == 0 ? strategy.equity / close * capital / 100 * mult : lot[1]
if up1 or up2
if strategy.position_size < 0
strategy.close_all()
strategy.entry("long", strategy.long, needlong == false ? 0 : lot, when=(time > timestamp(fromyear, frommonth, fromday, 00, 00) and time < timestamp(toyear, tomonth, today, 23, 59)))
if dn1 or dn2
if strategy.position_size > 0
strategy.close_all()
strategy.entry("Short", strategy.short, needshort == false ? 0 : lot, when=(time > timestamp(fromyear, frommonth, fromday, 00, 00) and time < timestamp(toyear, tomonth, today, 23, 59)))
if time > timestamp(toyear, tomonth, today, 23, 59) or exit
strategy.close_all()