トレンドフォロー移動平均RSI戦略

1
Follow
1779
Followers
概要
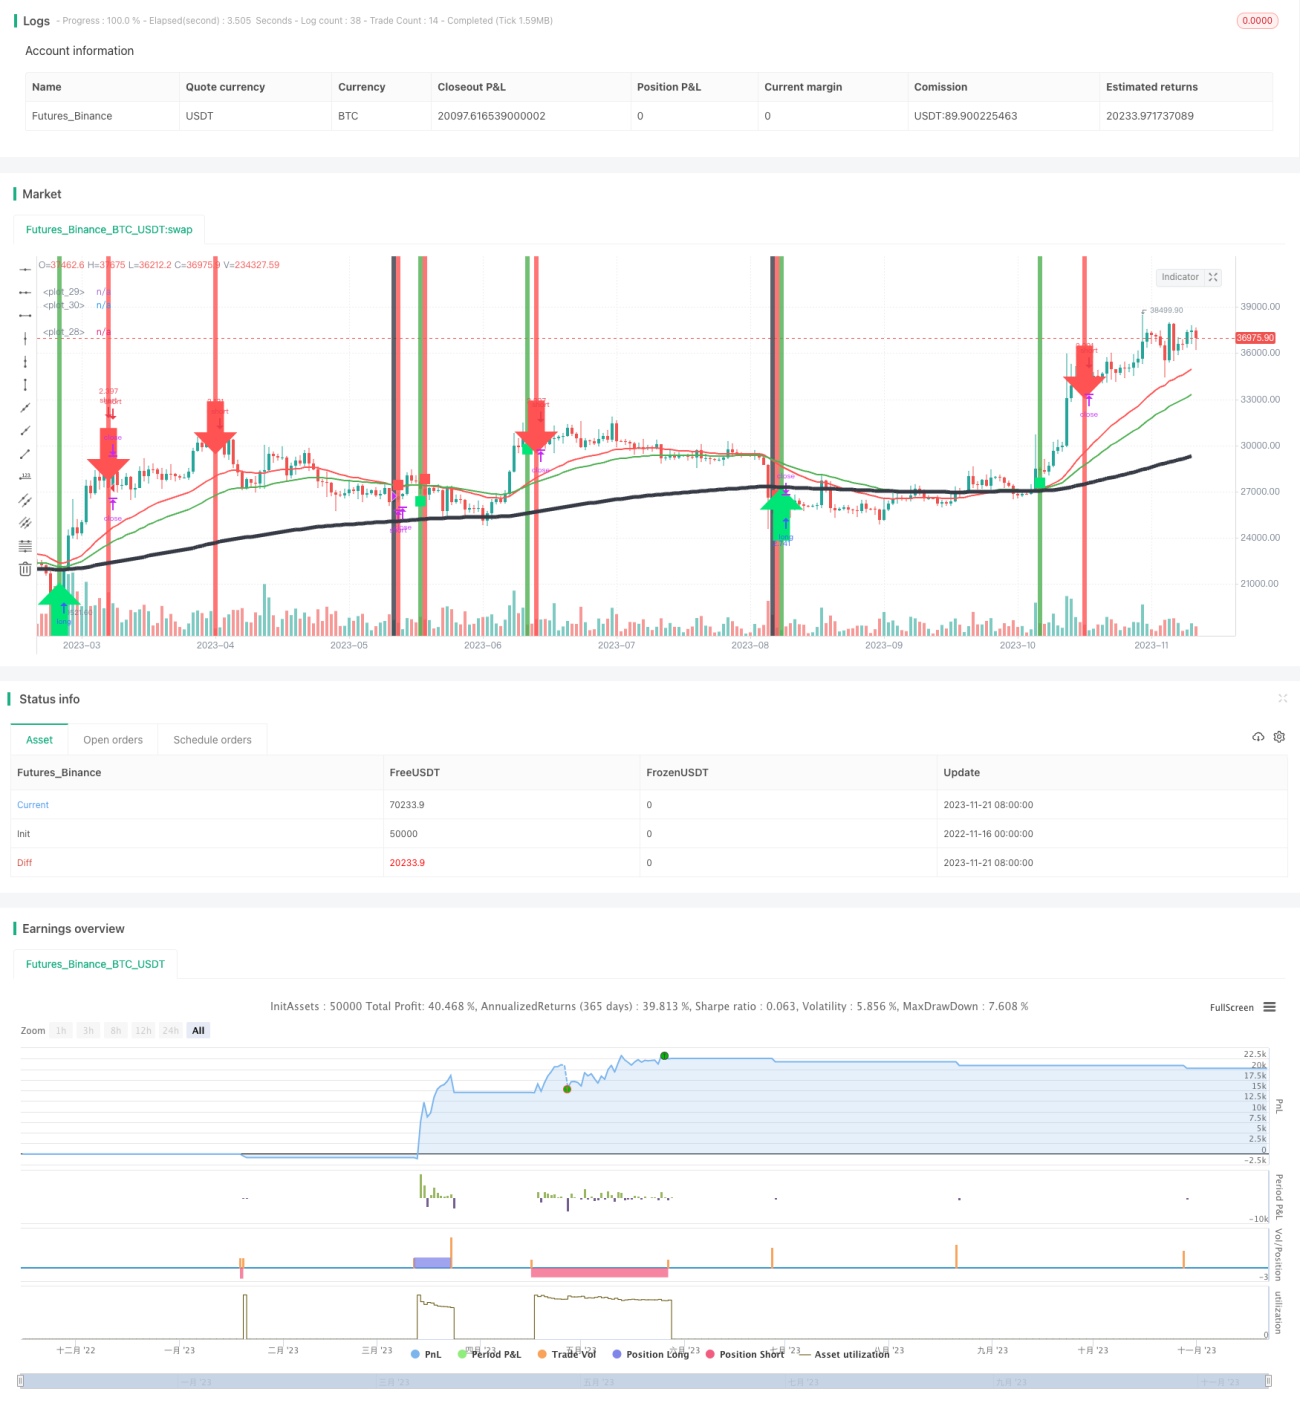
トレンド追跡移動平均RSI戦略は,トレンド分析と超買い超売り指標を同時に利用する株式自動取引戦略である.この戦略は,単純な移動平均を使用して市場のトレンド方向を判断し,比較的強い指数 ((RSI) 指数と組み合わせて取引信号を発信し,トレンドの判断と追跡を実現する.
戦略原則
この戦略は主に3つの部分から構成されています.
-
トレンド判断: 長期トレンドの200日単調移動平均を計算し,短期トレンドの30日および50日単調移動平均を計算する.短期移動平均線上を長期移動平均線を横切るときは看板の信号として,下を横切るときは下落の信号として,市場の長期短期トレンドを判断する.
-
超買超売判断:14日RSIを計算し,RSI80以上は超買区,20未満は超売区である. RSIが超買区から下落するか,超売区から上昇するときに取引信号を発信する.
-
入場と出場:超買超売信号を判断する際,トレンド判断の信号方向と一致する場合は,入場は多/空にする.短期と長期の移動平均が金色の交差点が発生する際,判断トレンドが逆転し,平仓出場する.
この戦略により,株価が逆転した時に間に合うように入場し,傾向判断と組み合わせて一部のノイズ取引をフィルターし,逆戻り制御において比較的優れている.
優位分析
この戦略の利点は以下の通りです.
- 傾向判断と超買超売の指標を組み合わせて,騒音をフィルターし,逆転点を識別します.
- 長期・短期の2つの時間帯のトレンドの方向を考慮すると判断がより正確になります.
- 移動平均をストップとして使用すると,市場の波動程度に応じてストップポイントを設定できます.
- 入場条件は厳格で,偽入口を効果的に防ぐことができます.
リスクと解決策
この戦略にはいくつかのリスクがあります.
- 長期にわたる波動が起こると,多くの無効取引が開かれる. 解決策は,多くのフィルタリング条件を追加して,無意味な取引を避けることである.
- 特定の時間遅れのリスクが存在します. 解決策は,移動平均の周期パラメータを適切に短縮することです.
- RSI指標が信号を発する効果は株式や市場に影響する。解決策は,K線形状などのより多くの要因を組み合わせて効果を判断する。
最適化の方向
この戦略は,以下の点で最適化できます.
- 交差量,K線形状など,より多くの<unk>波条件を加え,信号の有効性をさらに向上させる.
- 移動平均とRSIのパラメータ周期を最適化し,異なる株の特徴に適合させる.
- 動的移動平均を設定し,市場の波動性やリスクの好みに応じてパラメータを自動的に調整する.
- 機械学習などのより高度な技術により,市場動向を判断し,判断の正確性を向上させる.
要約する
トレンドトラッキングの移動平均RSI戦略は,全体的に非常に実用的な戦略的考えであり,傾向分析と超買い超売り指標を組み合わせると,ある程度市場の騒音をフィルターし,取引信号をより正確に有効にします.この戦略は,手段とパラメータを継続的に最適化することで,安定した収益性の高い長期的な取引システムになることができます.
Source
Pine
Strategy parameters
Related strategies
Comment
All comments (0)
No data
- 1