T3とCCI指標に基づくトレンドフォロー戦略

1
Follow
1779
Followers
T3指数とCCI指数に基づくトレンド追跡戦略
概要
これは,T3平滑移動平均とCCI指標を利用してトレンド追跡を実現する量化戦略である.この戦略は,T3-CCI指標を計算してトレンドを識別し,二重確認信号が得られたときに市場に出入してトレンドを追跡する.
戦略原則
この戦略は,まずT3平滑移動平均とCCI指標を計算し,CCI指標を一連の<unk>波でT3-CCI指標に計算する.T3-CCI指標が0軸を横切るときに買入シグナルを生じ,0軸を横切るときに売出シグナルを生じます.偽信号をフィルターするために,この戦略は,T3-CCI指標が2連期の同じ信号を維持することを要求します.
具体的には,この戦略は以下のステップを踏まえている.
- CCI指数とT3指数を計算する
- CCI指標をT3-CCI指標にデジタルフィルターで変換する
- T3-CCI指標の空白状態を判断する
- 2barの継続信号を待って,入場信号として
戦略的優位分析
この戦略の利点は以下の通りです.
- T3指標を利用してCCI指標を効率的に平らにし,市場騒音をフィルターする
- 偽信号を防ぐための二重確認の仕組み
- 長期トレンドを追跡し,短期的な回調を避ける
リスク分析
この戦略にはいくつかのリスクがあります.
- 震動の際に誤信号が発生しやすい
- 双重認証はショートラインの機会を逃している
- 大きくトレンドが逆転すると,止損のリスクが大きい.
対策として
- CCIとT3のパラメータを調整し,指標の効果を最適化する
- 確認周期を適当に短縮するか,または同時に遅いパラメータの組み合わせを実行できます.
- 移動停止または時効停止を使用して単一損失を制御する
最適化の方向
この戦略は以下の方向から最適化できます.
- CCIとT3のパラメータを周期と市場に合わせて調整する
- トレンド判定指標を増やし,信号の質を向上させる
- ストップポジションの自動調整
- 機械学習による動的最適化パラメータ
要約する
この戦略は,全体的に信頼性の高い中長線トレンド追跡戦略である.これは,二重確認とトレンド追跡特性を利用してリスクを制御し,トレンド取引の基本戦略として使用することができる.パラメータとルールの最適化により,戦略のパフォーマンスをさらに向上させることができる.
Source
Pine
/*backtest
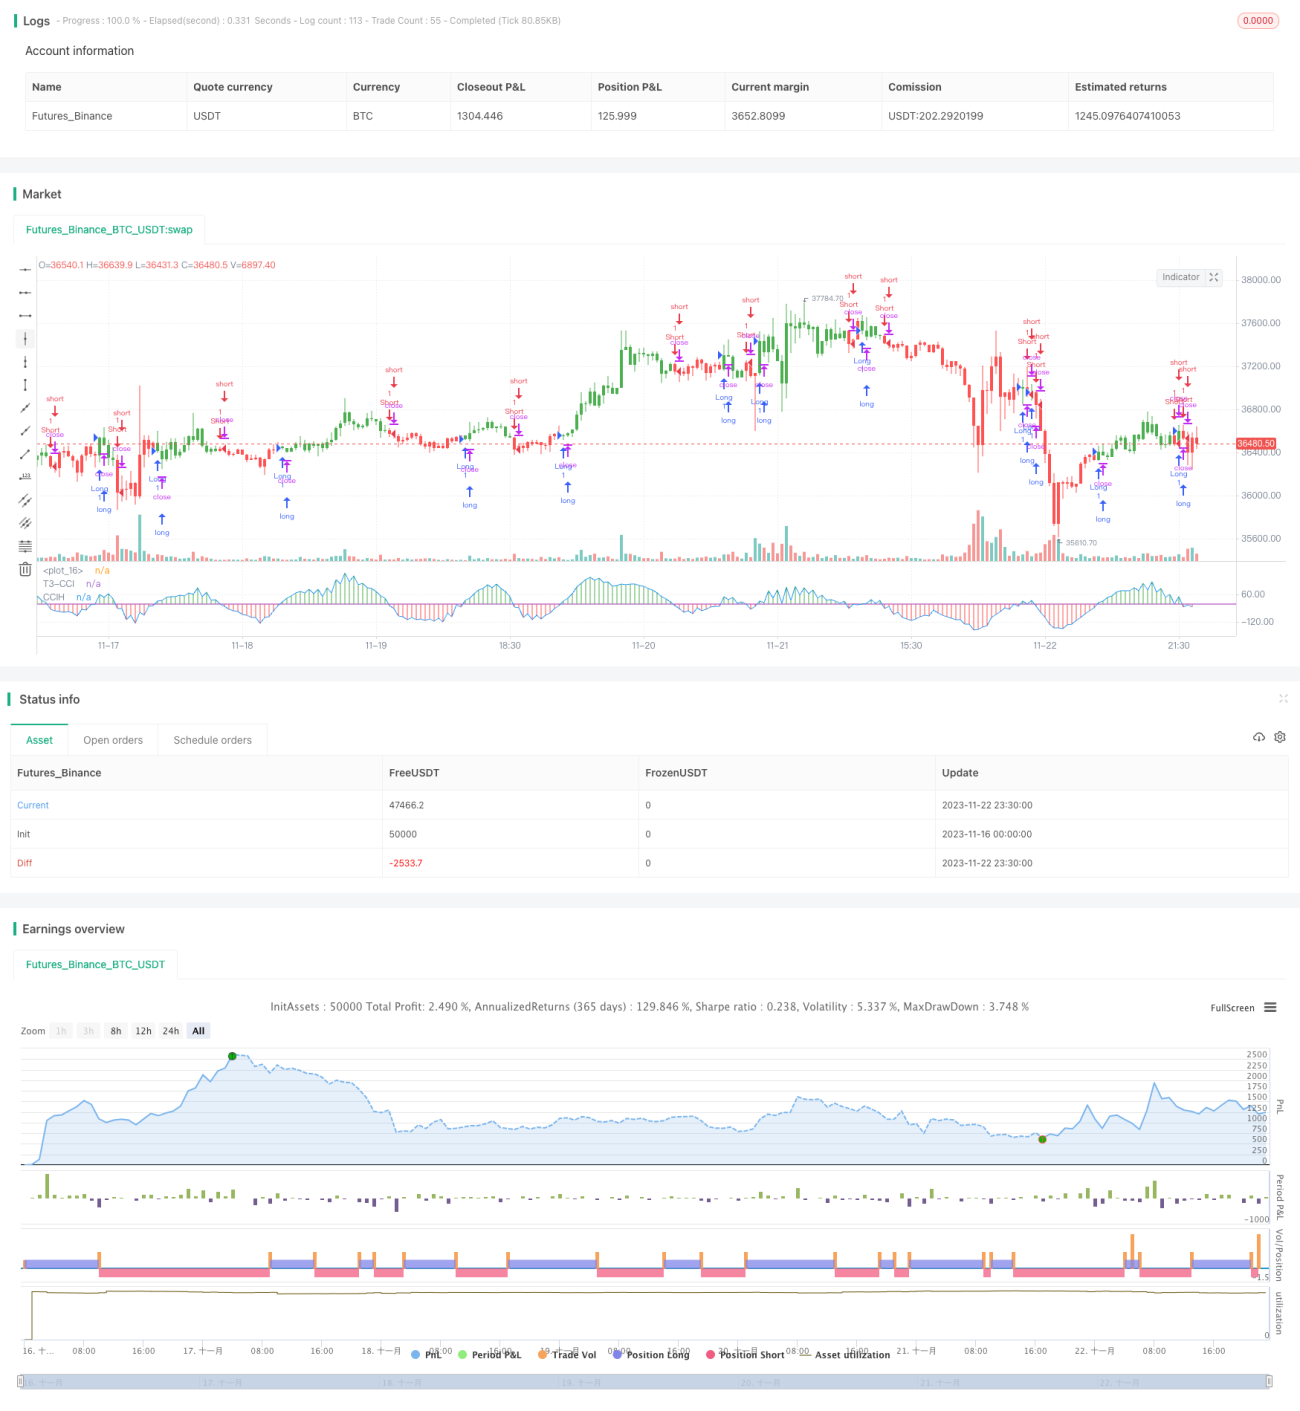
start: 2023-11-16 00:00:00
end: 2023-11-23 00:00:00
period: 30m
basePeriod: 15m
exchanges: [{"eid":"Futures_Binance","currency":"BTC_USDT"}]
*/
//@version = 2
////////////////////////////////////////////////////////////
// Copyright by HPotter v1.0 19/12/2016
// This simple indicator gives you a lot of useful information - when to enter, when to exitStrategy parameters
Related strategies
Comment
All comments (0)
No data
- 1