移動平均三銃士定量取引戦略
概要:この戦略は,一般的な技術分析戦略であり,通常使用されるいくつかの平均線指標EMAとRSI,MACD,PSRなどの補助指標を使用して,異なる周期平均線配置と指標信号の組み合わせを使用して,入場とストップのルールを形成し,低価格で高い価格を探します.
戦略原理:この戦略の核心は,5・9・21日平均線である。短周期平均線上を長周期平均線を横切るときには見込みが高く,短周期平均線下を長周期平均線を横切るときには見込みが低い。さらに,RSI指標と組み合わせて超買い超売りを判断し,MACD指標と組み合わせてトレンドを判断し,PSR指標と組み合わせてレジスタンスを識別して取引する。背景色は市場情緒を表示し,トレンドの方向を判断するのに役立ちます。パラメータを設定し,自己走行可能な組み合わせと配置入場ルールを設定する。
戦略的優位性分析:
- 平均線指数は明快で直感的で,トレンドの方向を簡単に判断できます.
- RSIは,超買超売の現象を効果的に識別し,MACDは,長短トレンドを判断し,PSRは,指標の組み合わせが互いを補完するキー価格を探します.
- 複数の入場ルールとパラメータの設定の柔軟性がある.
- 市場によって調整され,最適化される指標やパラメータの組み合わせが多くあります.
リスク分析:
- 短周期操作では,大きなトレンドを把握することが困難で,反転を逃すリスクがあります.
- パラメータを正しく設定しない場合,偽信号が多くなり,信号が欠けることがあります.
- 純粋に技術的な指標は,利回り機関によって利用され,損失を招く可能性があります.
- 震災が起きると 壊れやすい.
どう対処するか?
- 逆のショートライン操作を防ぐため,長線トレンドを適切に把握する.
- パラメータの組み合わせを最適化し,ストップ・ロスを設定し,リスクを制御する.
- 高位回転と低位反転の可能性に注意してください.
改善する方向:
- 平均線パラメータを調整し,最適な組み合わせをテストする.
- 他の補助指標のフィルタリング信号を追加する.
- 機械学習の指標判断の確率を高めること
- 取引量の変化と組み合わせた信号の精度.
- 損失拡大を防ぐために,損失停止策を増やす.
概要:この戦略は,複数の補助指標信号を統合し,均線指標の優位性を利用し,ショートラインの低買い高売りの機会を掘り下げます.パラメータの最適化と指標の組み合わせにより,戦略の効果を継続的に向上させることができますが,動作頻度とリスクを適度に制御し,単一の損失が全体の利益に影響を及ぼさないようにする必要があります.
||
Overview: This strategy is a typical technical analysis strategy that utilizes several common moving average indicators like EMA and auxiliary indicators like RSI, MACD, PSR to form entry and stop loss rules for finding low buy high sell opportunities.
Principle: The core of this strategy is the 5, 9, 21 day moving averages. When the short period MA crosses over the long period one, it signals an uptrend; when the short period MA crosses below the long period one, it signals a downtrend. In addition, RSI is used to determine overbought and oversold levels, MACD to judge the trend, PSR to identify support and resistance for combo trading. The background color shows market sentiment to assist trend judgment. The parameters are customizable for configuring entry rules.
Advantages:
- MA indicators give clear trend direction.
- RSI effectively spots overbought/oversold levels, MACD judges short-long trend, PSR finds key price levels. The indicators are complementary.
- Flexible entry rules and parameter settings.
- Many optimizable indicators and parameter combinations adaptable to varying market conditions.
Risks:
- Short-term operations may fail to capture major trend and miss reversals.
- Improper parameter configuration can lead to too many false signals or missing good signals.
- Pure technical indicators are susceptible to manipulation by arbitrageurs causing losses.
- Prone to being stopped out in high volatile markets.
Solutions:
- Capture mid-long term trend appropriately to avoid trading against major trend.
- Optimize parameters, use stop loss to control risks.
- Watch out the possibilities of pullback from highs and bounce from lows.
Optimization:
- Fine tune MA parameters for best combo.
- Add more indicators to filter signals.
- Increase machine learning metrics for probability estimate.
- Combine volume changes to enhance signal accuracy.
- Add stop loss to restrict loss expansion.
Summary: This strategy integrates multiple auxiliary signals, leverages the strength of MA indicators to identify short-term low buy high sell chances. Parameters and indicators combinations may be optimized continuously to improve strategy efficacy, but operation frequency and risks should be moderated to prevent oversized single trade loss from eroding overall profitability.
[/trans]
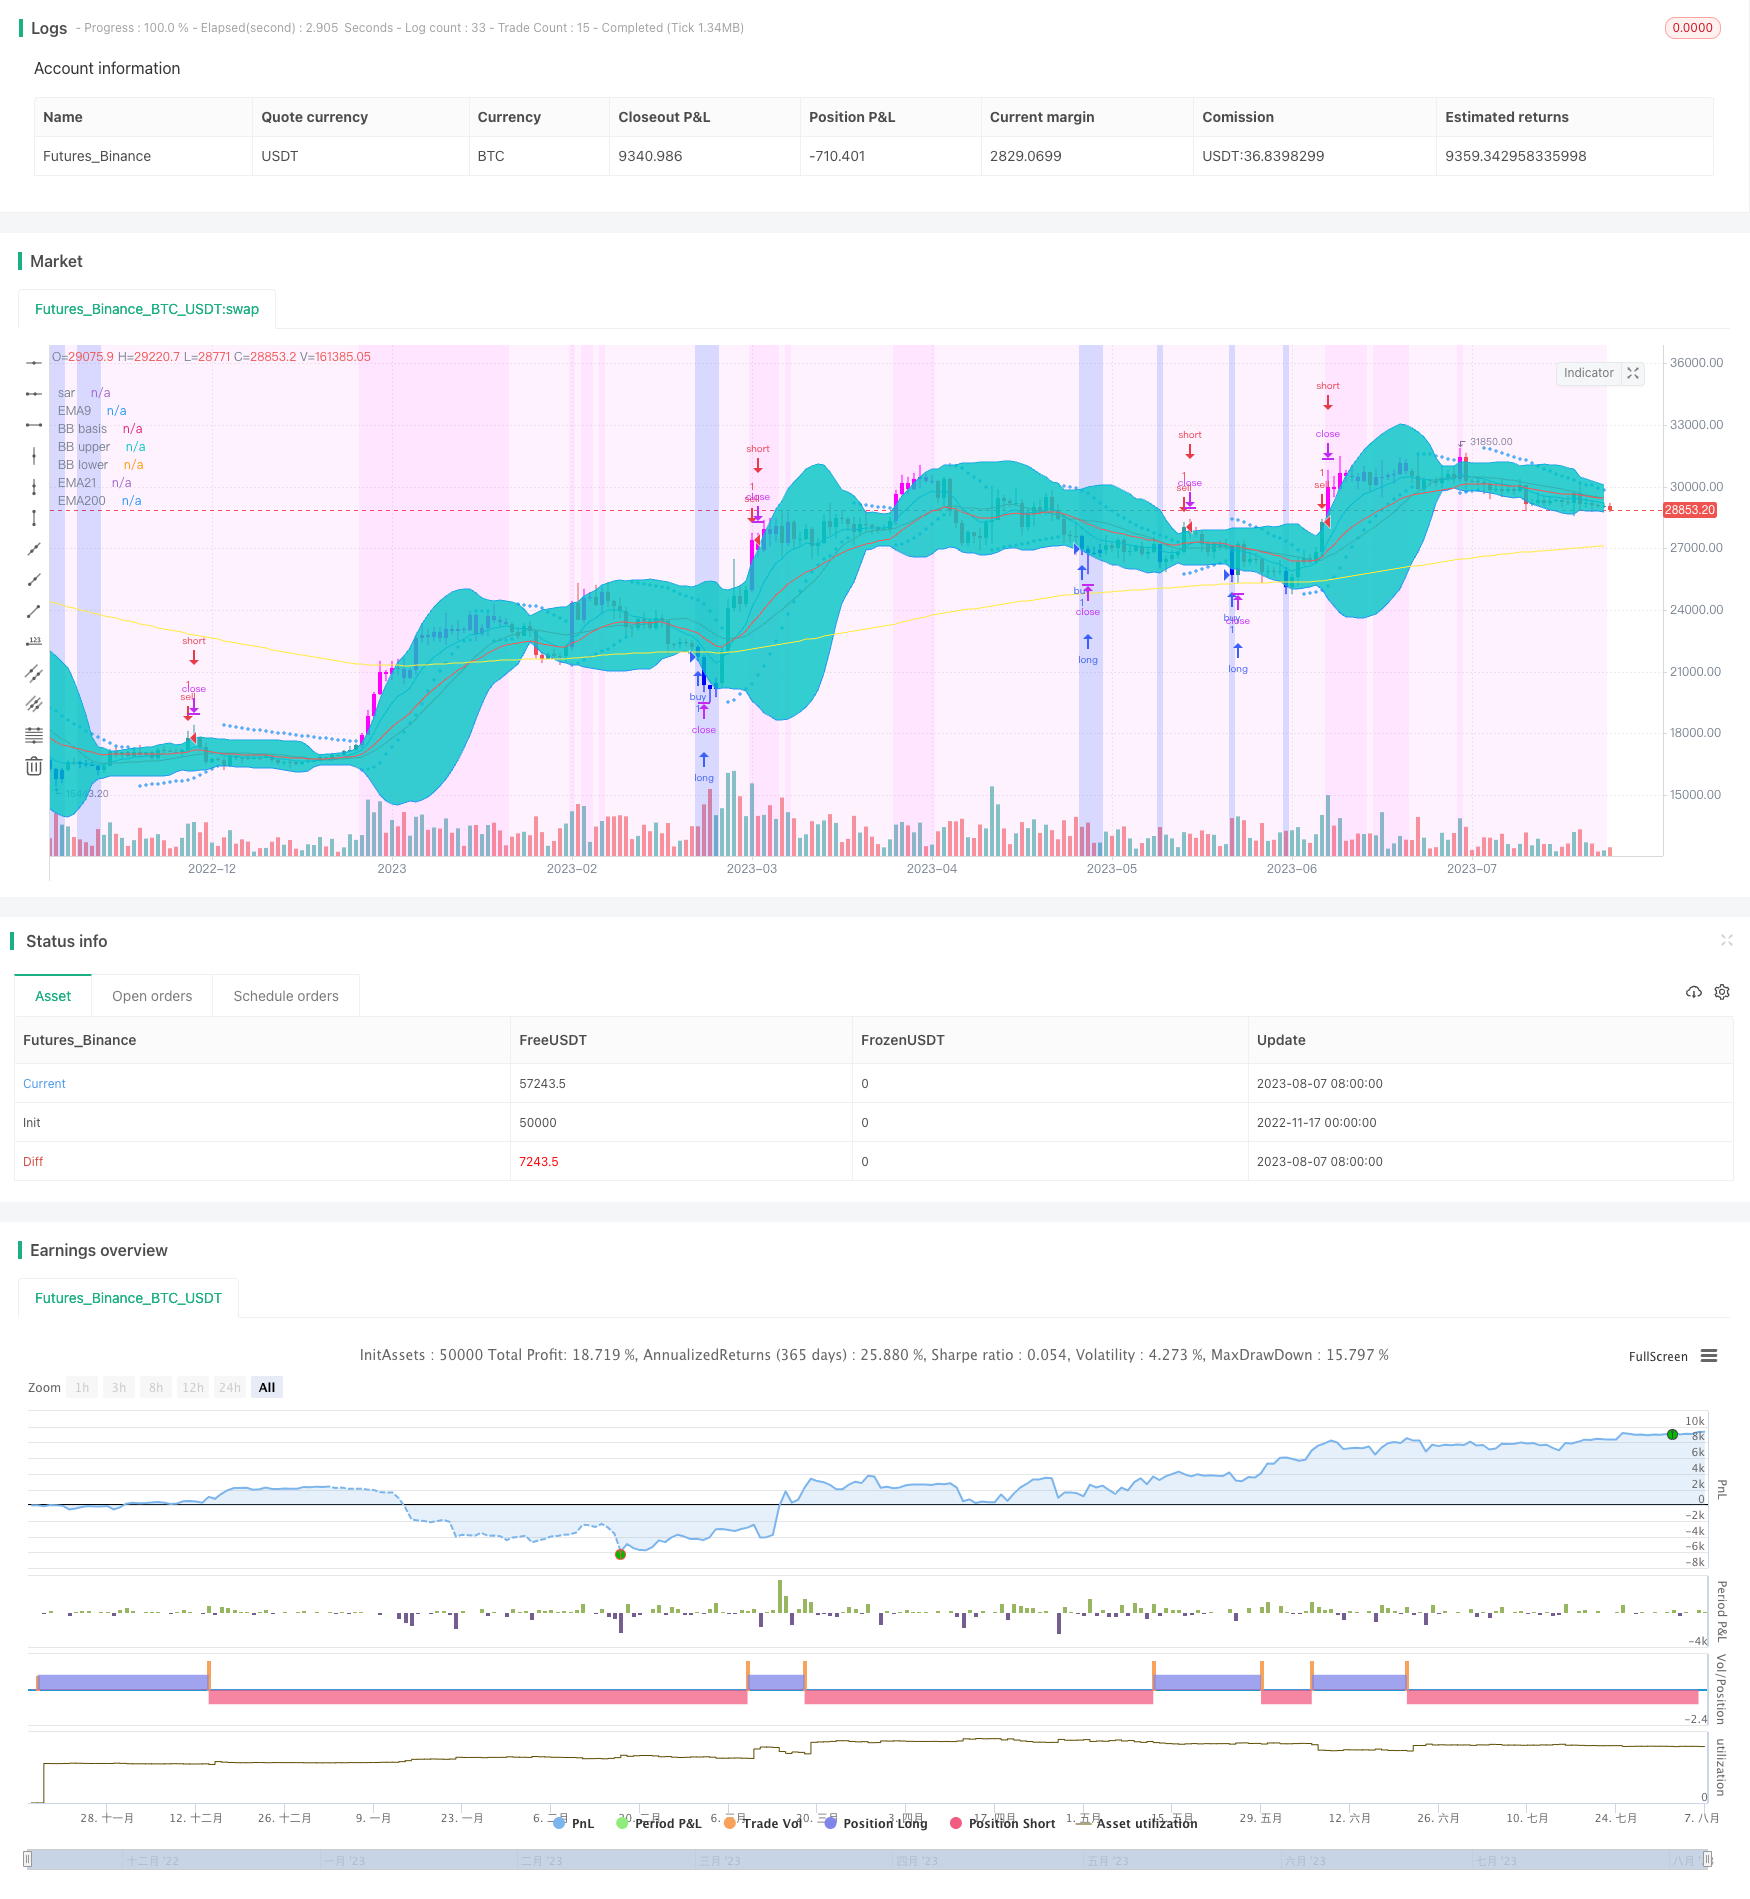
/*backtest
start: 2022-11-17 00:00:00
end: 2023-08-08 00:00:00
period: 1d
basePeriod: 1h
exchanges: [{"eid":"Futures_Binance","currency":"BTC_USDT"}]
*/

//@version=3
strategy("f.society v7", title="f.society v7", overlay=true)
//@Author: rick#1414
// -----------------------------------------------------
// f.society : Pone 3EMA: 5, 9, 21, 50, 100, 200, SAR,
// velas azules en sobreventa y velas moradas sobre compra
// SAR 0.02, 0.02, 0.2 , Bandas de Bollinger
// estrategia de compra y venta con rsi, macd o psr
// color de fondo: ema, rsi (color azul sobreventa 35, 25 (mas intenso))
// -----------------------------------------------------
// Como agregar a Trading view:
// 1 Cerrar todos los otros indicadores antes de añadirlo
// 2. Ir a la página de inicio TradingView.com
// 3. En la parte inferior, haga clic en Editor Pine // ver imagen: // https://cdn.discordapp.com/attachments/407267549047422976/407393815112974336/unknown.png
// 4. borrar todo el texo y reemplazar con todo el contenido de este archivo
// 5. Pulse el botón "Añadir a trazar" (Add to graph)
// -----------------------------------------------------
// revisar opciones de on y off segun indicadores deseados
// https://cdn.discordapp.com/attachments/405885820114042883/412115277883506700/unknown.png
// se puede cambiar la estrategia desde este menu desplegable para señales buy/sell

// Options
estrategia = input(defval="rsi", title = "Strategy", options=["ema","rsi","macd","psr","off","BB","ema5"])
in_bkcolor = input(defval="rsi", title = "background color", options=["ema","rsi","macd","psr","off","exchange","BB","ema5"])
e5 = input(title="Show ema5?", type=bool, defval=false)
e9 = input(title="Show ema9?", type=bool, defval=true)
e21 = input(title="Show ema21?", type=bool, defval=true)
e50 = input(title="Show ema50?", type=bool, defval=false)
e100 = input(title="Show ema100?", type=bool, defval=false)
e200 = input(title="Show ema200", type=bool, defval=true)
in_rsi = input(title="Color oversold and overbought bars?", type=bool, defval=true)
in_sar = input(title="Show Parabolic Sar", type=bool, defval=true)
in_bb = input(title="Show Bollinger Bands?", type=bool, defval=true)
sd = input(false, title="Show Daily Pivots?")
linew = input(1, title="linewidth", minval=0)
sarw = input(1, title="sar points width", minval=0)
ovs = input(40, title="oversold rsi", minval=0)
ovb = input(65, title="overbought rsi", minval=0)


//pf = input(false,title="Show Filtered Pivots")
pf=false

// 3 ema
src = close // input(close, title="Source")
//len9 = input(9, minval=1, title="ema9 Length")
//len21 = input(21, minval=1, title="ema21 Length")
//len200 = input(200, minval=1, title="ema200 Length")
len5=5
len9=9
len21=21
len50=50
len100=100
len200=200
ema5 = ema(src, len5)
ema9 = ema(src, len9)
ema21 = ema(src, len21)
ema50= ema(src, len50)
ema100 = ema(src, len100)
ema200 = ema(src, len200)
plot(e5? ema5 : na, title="EMA5", linewidth=linew, color=purple)
plot(e9? ema9 : na, title="EMA9", linewidth=linew, color=blue)
plot(e21? ema21 : na, title="EMA21", linewidth=linew, color=red)
plot(e50? ema50 : na, title="EMA50", linewidth=linew, color=green)
plot(e100? ema100 : na, title="EMA100", linewidth=linew, color=lime)
plot(e200? ema200 : na, title="EMA200", linewidth=linew, color=yellow)

// RSI Color
//lenR = input(14, minval=1, title="RSI Length")
lenR=14
//up = rma(max(change(src), 0), lenR)
//down = rma(-min(change(src), 0), lenR)
//vrsi = down == 0 ? 100 : up == 0 ? 0 : 100 - (100 / (1 + up / down))
vrsi=rsi(close,lenR)
//plot(vrsi,title="vrsi")
oversold = vrsi < ovs
overbought = vrsi > ovb
barcolor(in_rsi? oversold? #0000FF : overbought? #ff00ff:na : na)

// SAR
plot(in_sar? sar(0.02, 0.02, 0.2): na, style=cross, linewidth=sarw, color=blue, title="sar")

// BB
//length = input(20, title="Bollinger length", minval=1)
length=20
//mult = input(2.0, title="Bollinger stdDev", minval=0.001, maxval=50)
mult=2.0
basis = sma(src, length)
dev = mult * stdev(src, length)
upper = basis + dev
lower = basis - dev
plot(in_bb? basis :na, color=red, linewidth=linew, title="BB basis")
p1 = plot(in_bb? upper :na, color=blue, linewidth=linew, title="BB upper")
p2 = plot(in_bb? lower :na, color=blue, linewidth=linew, title="BB lower")
fill(p1, p2)

//background
bgcolor(in_bkcolor=="exchange"? #0000FF40 : in_bkcolor=="rsi"? vrsi < (ovs-15) ? #0000FF50  : vrsi < ovs ? #0000FF30 :( vrsi < ovb ? #ff00ff10 : #ff00ff20): in_bkcolor=="ema"?(ema9>ema21?#ff00ff10  : #0000FF20):in_bkcolor=="BB"?(lower>close?#ff00ff10 : close>upper?#0000FF20:#ff00ff10): in_bkcolor=="ema5"?(ema5>ema21?#ff00ff10  : #0000FF20):na)


// Strategy
if estrategia == "ema"
    strategy.entry("buy", true, 1, when= crossover(ema9,ema21) ),
    strategy.entry("sell", false, 1, when = crossover(ema21,ema9))
else
    if estrategia =="rsi"
        strategy.entry("buy", true, 1, when= vrsi <ovs),
        strategy.entry("sell", false, 1, when = vrsi > ovb or crossover(close,upper))
    else
        if estrategia =="macd"
            [macdLine, signalLine, histLine] = macd(close, 12, 26, 9),
            //bgcolor(macdLine > signalLine ? #98c8ff : #ff8b94),
            strategy.entry("buy", true, 1, when= macdLine>=signalLine ),
            strategy.entry("sell", false, 1, when = macdLine<signalLine)
        else
            if estrategia=="psr"
                leftBars = 4 //input(4)
                rightBars = 2 //input(2)
                swh = pivothigh(leftBars, rightBars)
                swl = pivotlow(leftBars, rightBars)
                swh_cond = not na(swh)
                hprice = 0.0
                hprice := swh_cond ? swh : hprice[1]
                le = false
                le := swh_cond ? true : (le[1] and high > hprice ? false : le[1])
                if (le)
                    strategy.entry("buy", strategy.long, comment="buy", stop=hprice + syminfo.mintick)
                swl_cond = not na(swl)
                lprice = 0.0
                lprice := swl_cond ? swl : lprice[1]
                se = false
                se := swl_cond ? true : (se[1] and low < lprice ? false : se[1])
                if (se)
                    strategy.entry("sell", strategy.short, comment="sell", stop=lprice - syminfo.mintick)
            else
                if estrategia=="BB"
                    strategy.entry("buy", true, 1, when= crossover(lower,close) ),
                    strategy.entry("sell", false, 1, when = crossover(close,upper))
                else
                    if estrategia=="ema5"
                        strategy.entry("buy", true, 1, when= crossover(ema5,ema21) ),
                        strategy.entry("sell", false, 1, when = crossover(ema21,ema5))


// pivots

// Classic Pivot
pivot = (high + low + close ) / 3.0
// Filter Cr
bull= pivot > (pivot + pivot[1]) / 2 + .0025
bear= pivot < (pivot + pivot[1]) / 2 - .0025
// Classic Pivots
r1 = pf and bear ? pivot + (pivot - low) : pf and bull ? pivot + (high - low) : pivot + (pivot - low)
s1 = pf and bull ? pivot - (high - pivot) : pf and bear ? pivot - (high - low) : pivot - (high - pivot)
r2 = pf ? na : pivot + (high - low)
s2 = pf ? na : pivot - (high - low)
//Pivot Average Calculation
smaP = sma(pivot, 3)
//Daily Pivots
dtime_pivot = request.security(syminfo.tickerid, 'D', pivot[1])
dtime_pivotAvg = request.security(syminfo.tickerid, 'D', smaP[1])
dtime_r1 = request.security(syminfo.tickerid, 'D', r1[1])
dtime_s1 = request.security(syminfo.tickerid, 'D', s1[1])
dtime_r2 = request.security(syminfo.tickerid, 'D', r2[1])
dtime_s2 = request.security(syminfo.tickerid, 'D', s2[1])
offs_daily = 0
plot(sd and dtime_pivot ? dtime_pivot : na, title="Daily Pivot",style=line, color=fuchsia,linewidth=linew)
plot(sd and dtime_r1 ? dtime_r1 : na, title="Daily R1",style=line, color=#DC143C,linewidth=linew)
plot(sd and dtime_s1 ? dtime_s1 : na, title="Daily S1",style=line, color=lime,linewidth=linew)
plot(sd and dtime_r2 ? dtime_r2 : na, title="Daily R2",style=line, color=maroon,linewidth=linew)
plot(sd and dtime_s2 ? dtime_s2 : na, title="Daily S2",style=line, color=#228B22,linewidth=linew)


// References:
// get number of bars since last green bar
//plot(barssince(close >= open), linewidth=3, color=blue)
//bgcolor(close < open ? #ff8b94   : #98c8ff , transp=10)
//http://www.color-hex.com/
//   #98c8ff    light blue
//    #ff8b94   red   #b21c0e
//       #7d1d90    purple
//    #0029ff blue
//    #fffa86   yellow