動的移動平均追跡戦略
概要
この戦略の核心的な考え方は,動的移動平均を使用してトレンドを追跡し,ストップを設定し,ハイクリンヒック技術指示と組み合わせて多空信号判断を行うことです.ATR指標は動的移動平均とストップ位置を計算するために使用されます.
戦略原則
この戦略は,まずATR指標を計算し,その後,入力された価格源とパラメータを組み合わせて,動的移動平均を計算する.価格が動的移動平均より高く/低くなる時,多/空信号を生成する.同時に,ストップ・ロスト・ポジションを設定し,価格変化を追跡し,リアルタイムで更新する.
具体的には,まずATR指数とパラメータnLossを計算する. 次に,現在の周期価格と前期のストップポジションを計算し,両方を比較してストップラインを更新する. 価格が前期のストップラインを破るときに多/空信号posと対応する色を生成する. 取引信号を生成すると,矢印のマークを描く. 最後に,ストップストップの論理に基づいて平仓する.
優位分析
この戦略の最大の利点は,ダイナミックな移動平均を利用して価格の変化をリアルタイムで追跡することにある.これは,従来の固定移動平均よりもトレンドを捉え,ストップ・ロスの可能性を下げることにある.また,ATRストップと組み合わせて,市場の波動幅に応じてストップ・ロスの位置を柔軟に調整し,リスクを効果的に制御することができる.
リスクと解決策
この戦略の主なリスクは,価格が大きく飛躍し,ストップラインを突破して誤ったシグナルを生む可能性があることにある.また,条件の設定が不適切であることも,あまりにも頻繁に取引につながる可能性がある.
解決策は,移動平均期数を最適化し,ATRとストップデフォルトのサイズを調整し,誤信号の確率を低減する.また,過密取引を避けるためにフィルタリング条件を設定することができます.
最適化の方向
この戦略は以下の点で最適化できます.
異なるタイプと周期の移動平均をテストし,最適なパラメータの組み合わせを見つける
ATRサイクルパラメータを最適化して,停止損失感性をバランスする
追加フィルタリング条件と指標を追加し,信号の質を向上させる
ストップ・ローズ・ストップ値の調整,利益リスク比の最適化
要約する
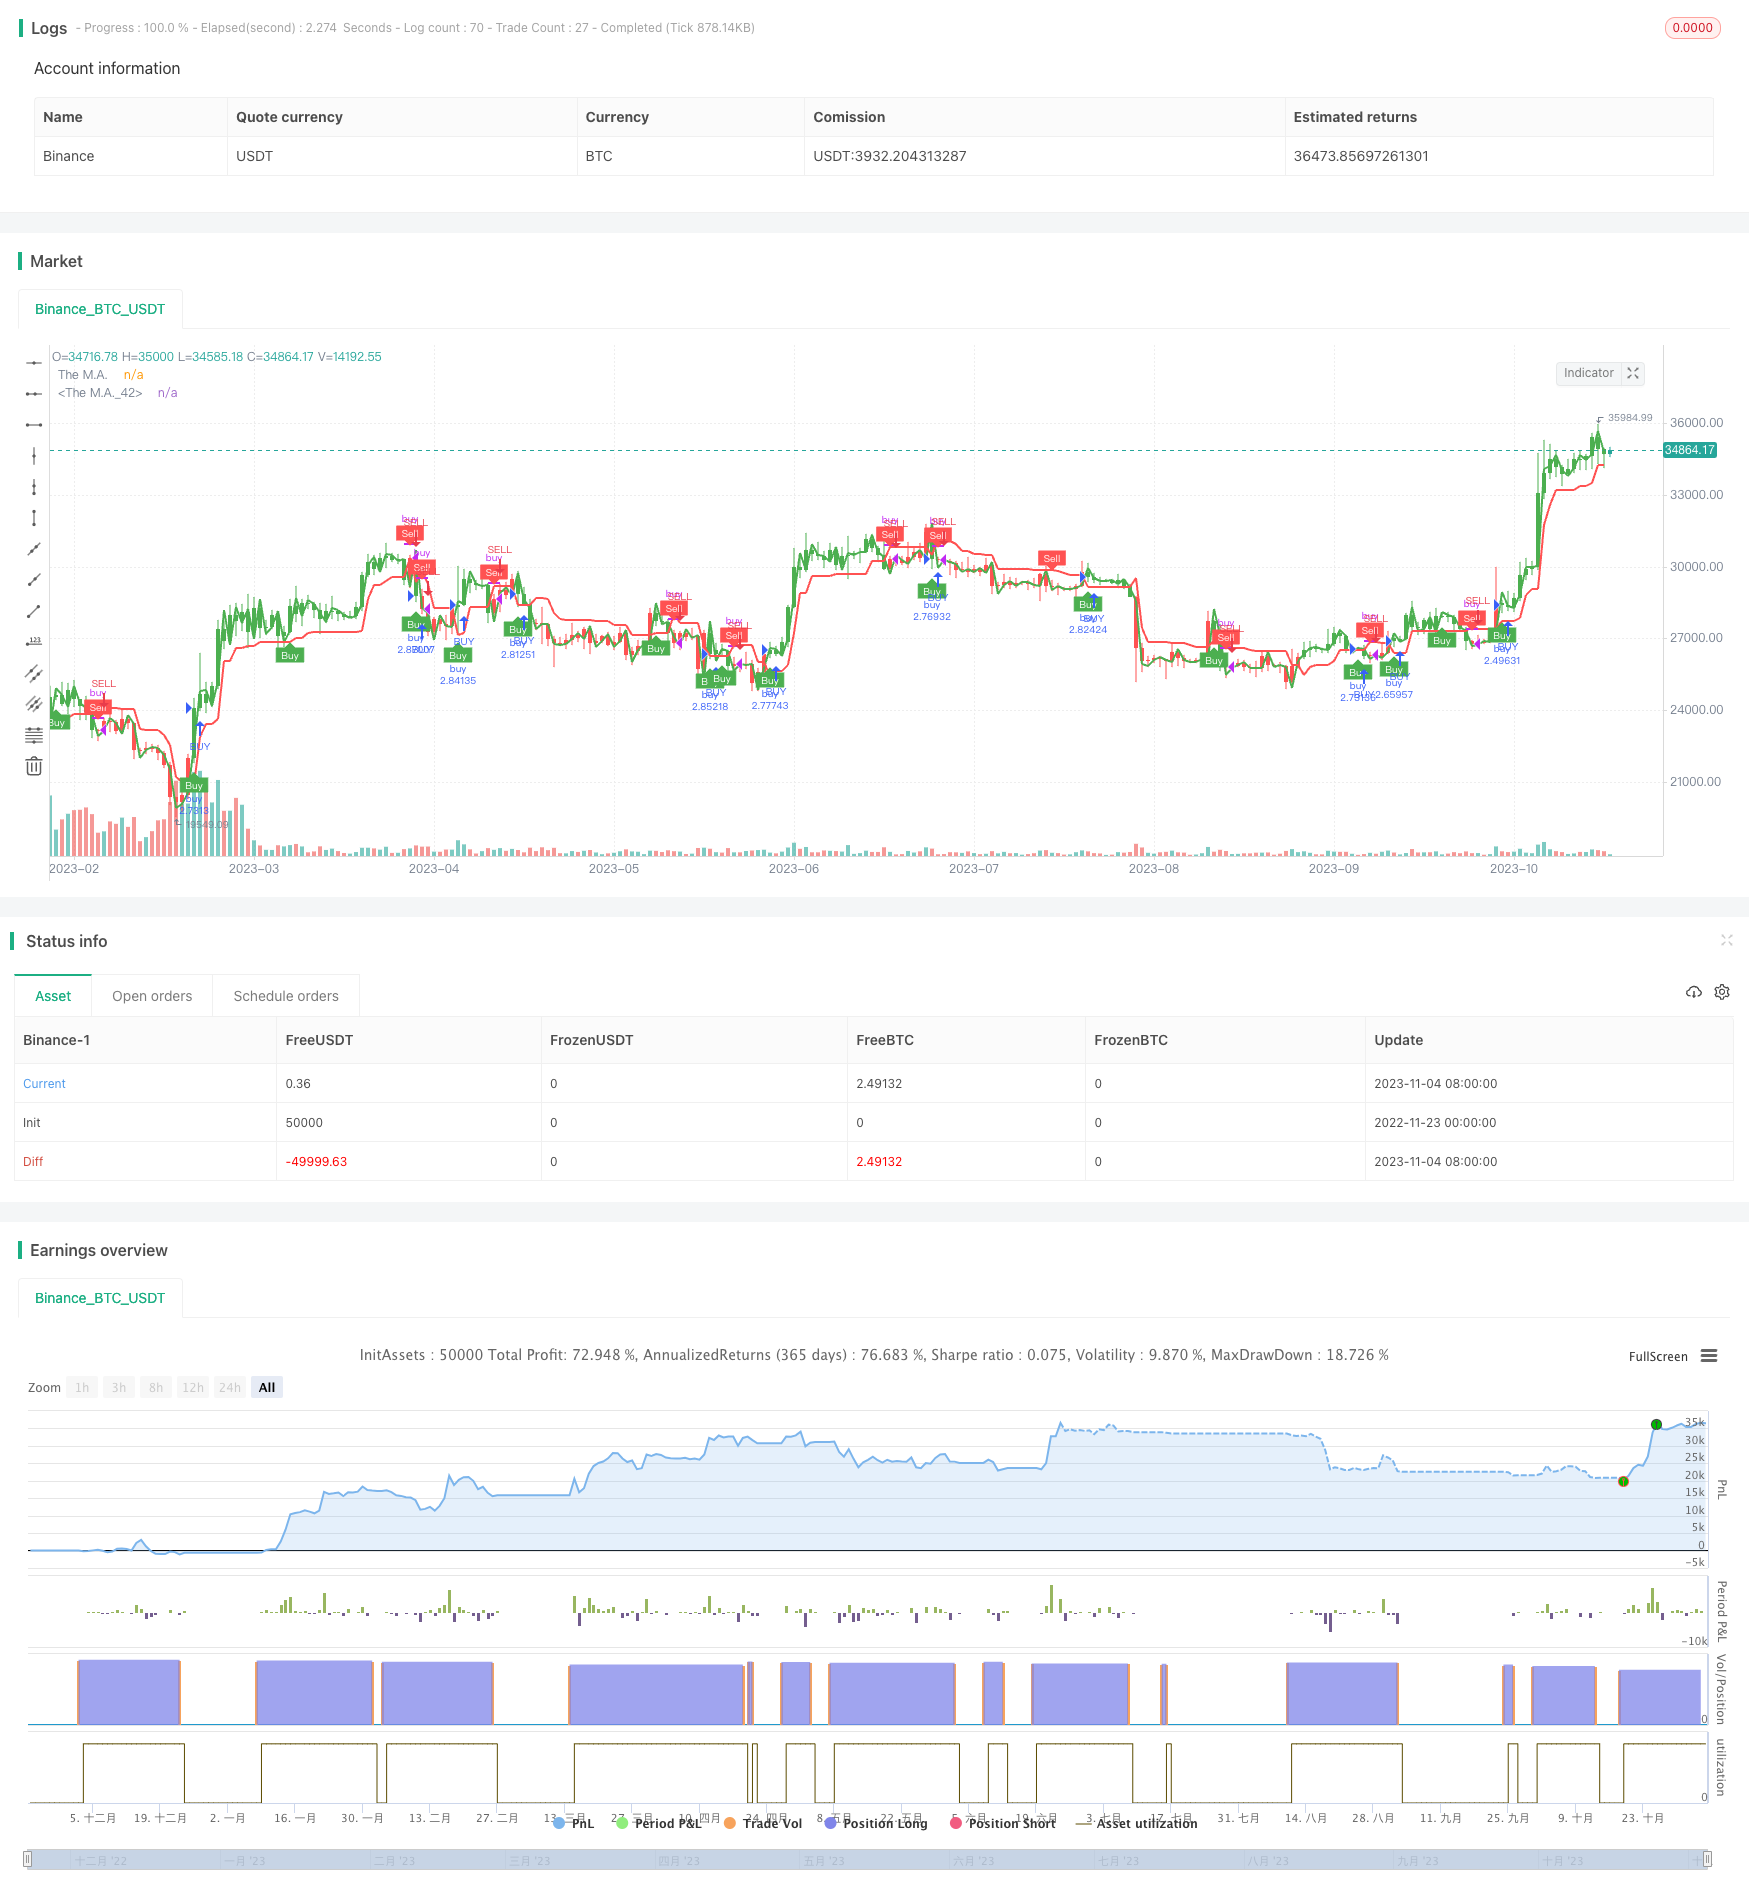
この戦略の核心構想は,動的移動平均線が価格変化をリアルタイムで追跡し,ATR指標を動的にストップポジションに設定し,トレンドを追跡しながらもリスクを厳格に制御することです.パラメータの最適化とルール修正により,この戦略を非常に実用的な量化システムに調教することができます.
/*backtest
start: 2022-11-23 00:00:00
end: 2023-11-05 05:20:00
period: 1d
basePeriod: 1h
exchanges: [{"eid":"Binance","currency":"BTC_USDT","stocks":0}]
*/

//@version=5
strategy(title='UT Bot v5', overlay=true, default_qty_type=strategy.percent_of_equity, default_qty_value=100)
//CREDITS to HPotter for the orginal code. The guy trying to sell this as his own is a scammer lol.
//Edited and converted to @version=5 by SeaSide420 for Paperina
// Inputs
AllowBuy = input(defval=true, title='Allow Buy?')
AllowSell = input(defval=false, title='Allow Sell?')
h = input(false, title='Signals from Heikin Ashi Candles')
//revclose = input(defval=true, title='Close when reverse signal?')
Price = input(defval=open, title='Price Source (recommended OPEN to avoid repainting)')
smoothing = input.string(title="Moving Average Type", defval="HMA", options=["SMA", "EMA", "WMA", "HMA"])
MA_Period = input(2, title='This changes the MAPeriod')
a = input.float(1, title='This changes the sensitivity',step=0.1)
c = input(11, title='ATR Period')
TakeProfit = input.int(defval=50000, title='Take Profit ($)', minval=1)
StopLoss = input.int(defval=50000, title='Stop Loss ($)', minval=1)
xATR = ta.atr(c)
nLoss = a * xATR
src = h ? request.security(ticker.heikinashi(syminfo.tickerid), timeframe.period, Price, lookahead=barmerge.lookahead_off) : Price
xATRTrailingStop = 0.0
iff_1 = src > nz(xATRTrailingStop[1], 0) ? src - nLoss : src + nLoss
iff_2 = src < nz(xATRTrailingStop[1], 0) and src[1] < nz(xATRTrailingStop[1], 0) ? math.min(nz(xATRTrailingStop[1]), src + nLoss) : iff_1
xATRTrailingStop := src > nz(xATRTrailingStop[1], 0) and src[1] > nz(xATRTrailingStop[1], 0) ? math.max(nz(xATRTrailingStop[1]), src - nLoss) : iff_2
pos = 0
iff_3 = src[1] > nz(xATRTrailingStop[1], 0) and src < nz(xATRTrailingStop[1], 0) ? -1 : nz(pos[1], 0)
pos := src[1] < nz(xATRTrailingStop[1], 0) and src > nz(xATRTrailingStop[1], 0) ? 1 : iff_3
xcolor = pos == -1 ? color.red : pos == 1 ? color.green : color.blue
ma_function(src, MA_Period) =>
    switch smoothing
        "SMA" => ta.sma(src, MA_Period)
        "EMA" => ta.ema(src, MA_Period)
        "WMA" => ta.wma(src, MA_Period)
        => ta.hma(src, MA_Period)
thema = ma_function(src, MA_Period)
above = ta.crossover(thema, xATRTrailingStop)
below = ta.crossover(xATRTrailingStop, thema)
buy = src > xATRTrailingStop and above
sell = src < xATRTrailingStop and below
barbuy = src > xATRTrailingStop
barsell = src < xATRTrailingStop
plot(thema,title="The M.A.",color=color.green,linewidth=2)
plot(xATRTrailingStop,title="The M.A.",color=color.red,linewidth=2)
plotshape(buy,  title = "Buy",  text = "Buy",  style = shape.labelup,   location = location.belowbar, color= color.green, textcolor = color.white, size = size.tiny)
plotshape(sell, title = "Sell", text = "Sell", style = shape.labeldown, location = location.abovebar, color= color.red,   textcolor = color.white, size = size.tiny)
barcolor(barbuy ? color.green : na)
barcolor(barsell ? color.red : na)
strategy.close_all(when=strategy.openprofit>TakeProfit,alert_message="Close- TakeProfit", comment = "TP")
strategy.close_all(when=strategy.openprofit<StopLoss-(StopLoss*2),alert_message="Close- StopLoss", comment = "SL")
strategy.close("buy", when =  sell and AllowSell==false , comment = "close buy")
strategy.close("sell", when =  buy and AllowBuy==false, comment = "close sell")
strategy.entry("buy", strategy.long, when = buy and AllowBuy)
strategy.entry("sell", strategy.short, when = sell and AllowSell)