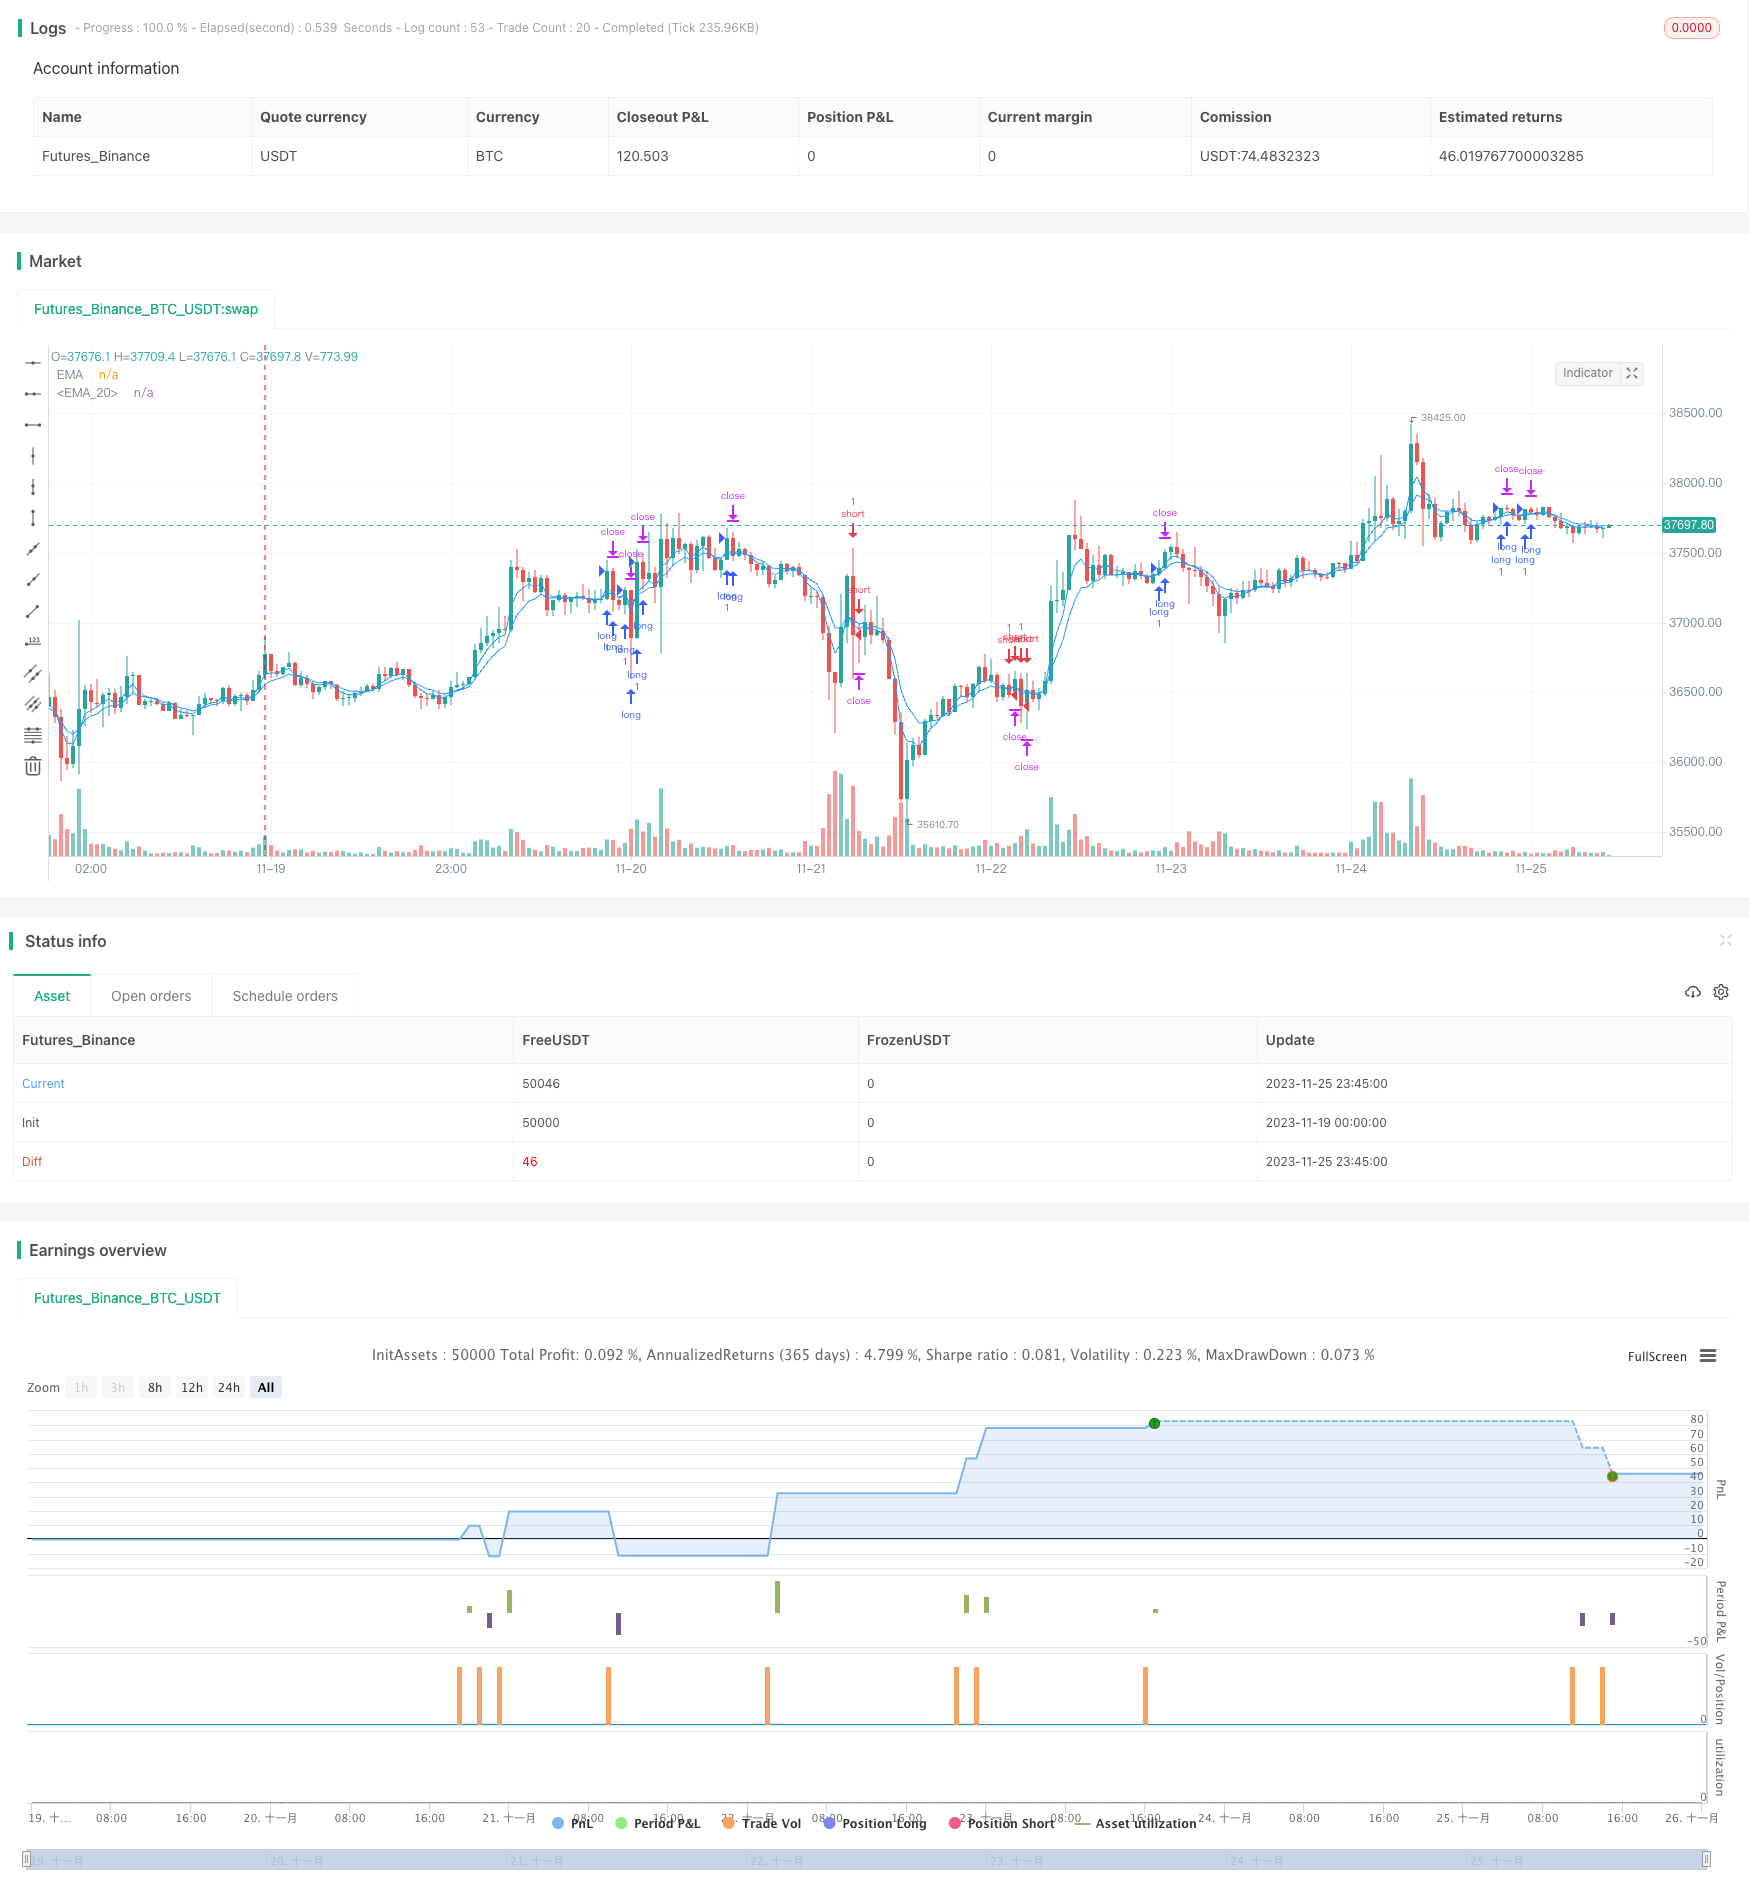
4つの指標による移動平均反転戦略

概要
この戦略は,移動平均EMA,相対的に強い指標RSI,商品チャンネル指標CCIの3つの主要な指標を組み合わせ,EMA平均線が逆転しているかどうかを認識し,その後,RSIとCCIの買入した指標を使用して補助判断を行い,取引信号を形成します.中期取引戦略に属します.
戦略原則
4周期と8周期のEMA平均線を交差して価格傾向を判断し,4周期の急速な判断,8周期の遅い決定;
EMA平均線が上向きに回転すると,すなわち4周期線に8周期線を穿い,RSI指標が65より高い ((相対的超買区) とCCI指標が0より高い ((超買超売がないことを意味する) を補足して判断すると,満足は多行シグナルを生成する.
EMA平均線が下向きに回転すると,すなわち4周期線の下の8周期線を通過すると,さらにRSI指標が35以下 ((相対的超売区) とCCI指標が0以下 ((表示する超買超売はない) を補足して判断すると,満足は空調信号を生成する.
信号が形成された後,入力された止損距離と止止距離に応じて止損と止止価格を設定する.
全体として,この戦略は,中短期価格の傾向と短期指標の超買い超売り区間回避を考慮し,比較的安定しており,ストップ・ストップの設定は,単一取引の最大損失を効果的に制御します.
優位分析
複数の指標を総合的に判断し,誤判の可能性が高い単一の指標の取引戦略を避ける.
EMA平均線は主動傾向を判断し,短期的な波動から誤った判断を避ける.RSIとCCIの指標は,超買い超売り領域を避けて,勝率を増やす.
自動設定のストップ・ロズとストップ・ストップは,単一取引のリスクを制御し,極端な状況から損失の拡大を効果的に防止します.
この戦略は技術面の取引戦略であり,基本面に影響を受けず,市場の任意の位周期で使用でき,実盤に容易に利用できる.
リスク分析
技術指標は,突然の大きな利差/良いニュースの前に失効しやすい.
株価が急激に波動すると,ストップは突破される可能性があるので,ストップ幅は適切に緩和されるべきである.
この戦略は,取引コストが収益に一定影響を及ぼし,コスト優位性の高い高周波戦略に適しています.
最適化の方向
機械学習のアルゴリズムを追加し,株の基本面に合わせてパラメータを自動的に調整する.
固定的な止損距離ではなく,自主的な止損機構を追加する.
要約する
この取引戦略は,複数の指標を統合して判断し,合理的なパラメータを設定すると,比較的安定した中短期の取引利益を得ることができる.これは,実盤に容易な技術面の戦略である.しかしながら,突発的な重要な基本的ニュースを防ぎ,適切な緩解の止損距離などのリスク予防措置を注意すべきである.これは,将来的にさらに最適化できる方向でもある.
/*backtest
start: 2023-11-19 00:00:00
end: 2023-11-26 00:00:00
period: 45m
basePeriod: 5m
exchanges: [{"eid":"Futures_Binance","currency":"BTC_USDT"}]
*/

// This source code is subject to the terms of the Mozilla Public License 2.0 at https://mozilla.org/MPL/2.0/
// © SoftKill21

//@version=4


strategy(title="Moving Average Exponential", shorttitle="EMA", overlay=true)


len4 = input(4, minval=1, title="Length_MA4")
src4 = input(close, title="Source")
offset4 = input(title="Offset", type=input.integer, defval=0, minval=-500, maxval=500)
out4 = ema(src4, len4)
plot(out4, title="EMA", color=color.blue, offset=offset4)

len8 = input(8, minval=1, title="Length_MA8")
src8 = input(close, title="Source")
offset8 = input(title="Offset", type=input.integer, defval=0, minval=-500, maxval=500)
out8 = ema(src8, len8)
plot(out8, title="EMA", color=color.blue, offset=offset8)


//rsioma
src = close, len = input(14, minval=1, title="Length")
up = rma(max(change(ema(src, len)), 0), len)
down = rma(-min(change(ema(src, len)), 0), len)
rsi = down == 0 ? 100 : up == 0 ? 0 : 100 - (100 / (1 + up / down))
//plot(rsi, color=color.blue)
//band1 = hline(80)
//band0 = hline(20)
//fill(band1, band0, color=color.purple, transp=90)
//hline(50, color=color.gray, linestyle=plot.style_line)
sig = ema(rsi, 21)
//plot(sig, color=color.purple)

//woodie
cciTurboLength = input(title="CCI Turbo Length", type=input.integer, defval=6, minval=3, maxval=14)
cci14Length = input(title="CCI 14 Length", type=input.integer, defval=14, minval=7, maxval=20)

source = close

cciTurbo = cci(source, cciTurboLength)
cci14 = cci(source, cci14Length)

last5IsDown = cci14[5] < 0 and cci14[4] < 0 and cci14[3] < 0 and cci14[2] < 0 and cci14[1] < 0
last5IsUp = cci14[5] > 0 and cci14[4] > 0 and cci14[3] > 0 and cci14[2] > 0 and cci14[1] > 0
histogramColor = last5IsUp ? color.green : last5IsDown ? color.red : cci14 < 0 ? color.green : color.red


// Exit Condition
// Exit Condition
a = input(12)*10
b = input(15)*10
c = a*syminfo.mintick
d = b*syminfo.mintick


longCondition = crossover(out4, out8) and (rsi >= 65 and cci14>=0)
shortCondition = crossunder(out4, out8) and (rsi <=35 and cci14<=0)


long_stop_level     = float(na)
long_profit_level1  = float(na)
long_profit_level2  = float(na)
long_even_level     = float(na)

short_stop_level    = float(na)
short_profit_level1 = float(na)
short_profit_level2 = float(na)
short_even_level    = float(na)

long_stop_level     := longCondition  ? close - c : long_stop_level     [1]
long_profit_level1  := longCondition  ? close + d : long_profit_level1  [1]
//long_profit_level2  := longCondition  ? close + d : long_profit_level2  [1]
//long_even_level     := longCondition  ? close + 0 : long_even_level     [1]

short_stop_level    := shortCondition ? close + c : short_stop_level    [1]
short_profit_level1 := shortCondition ? close - d : short_profit_level1 [1]
//short_profit_level2 := shortCondition ? close - d : short_profit_level2 [1]
//short_even_level    := shortCondition ? close + 0 : short_even_level    [1]


//ha
// === Input ===
//ma1_len = input(1, title="MA 01")
//ma2_len = input(40, title="MA 02")

// === MA 01 Filter ===
//o=ema(open,ma1_len)
//cc=ema(close,ma1_len)
//h=ema(high,ma1_len)
//l=ema(low,ma1_len)

// === HA calculator ===
//ha_t = heikinashi(syminfo.tickerid)
//ha_o = security(ha_t, timeframe.period, o)
//ha_c = security(ha_t, timeframe.period, cc)
//ha_h = security(ha_t, timeframe.period, h)
//ha_l = security(ha_t, timeframe.period, l)

// === MA 02 Filter ===
//o2=ema(ha_o, ma2_len)
//c2=ema(ha_c, ma2_len)
//h2=ema(ha_h, ma2_len)
//l2=ema(ha_l, ma2_len)

// === Color def ===
//ha_col=o2>c2 ? color.red : color.lime

// ===  PLOTITING===
//plotcandle(o2, h2, l2, c2, title="HA Smoothed", color=ha_col)

tp=input(120)
sl=input(96)

strategy.entry("long", strategy.long, when = longCondition)
//strategy.close("long", when = o2>c2 , comment="ha_long")
strategy.entry("short", strategy.short , when =shortCondition )
//strategy.close("short", when = o2<=c2 , comment = "ha_short" )

//strategy.close("long",when=long_profit_level1 or long_stop_level  , comment="tp/sl")
//strategy.close("short",when=short_profit_level1 or short_stop_level , comment="tp/sl")

strategy.exit("x_long","long",profit = tp, loss = sl) //when = o2>c2)
strategy.exit("x_short","short",profit = tp, loss = sl) //when = o2<c2)