移動平均クロスオーバー取引戦略

1
Follow
1779
Followers
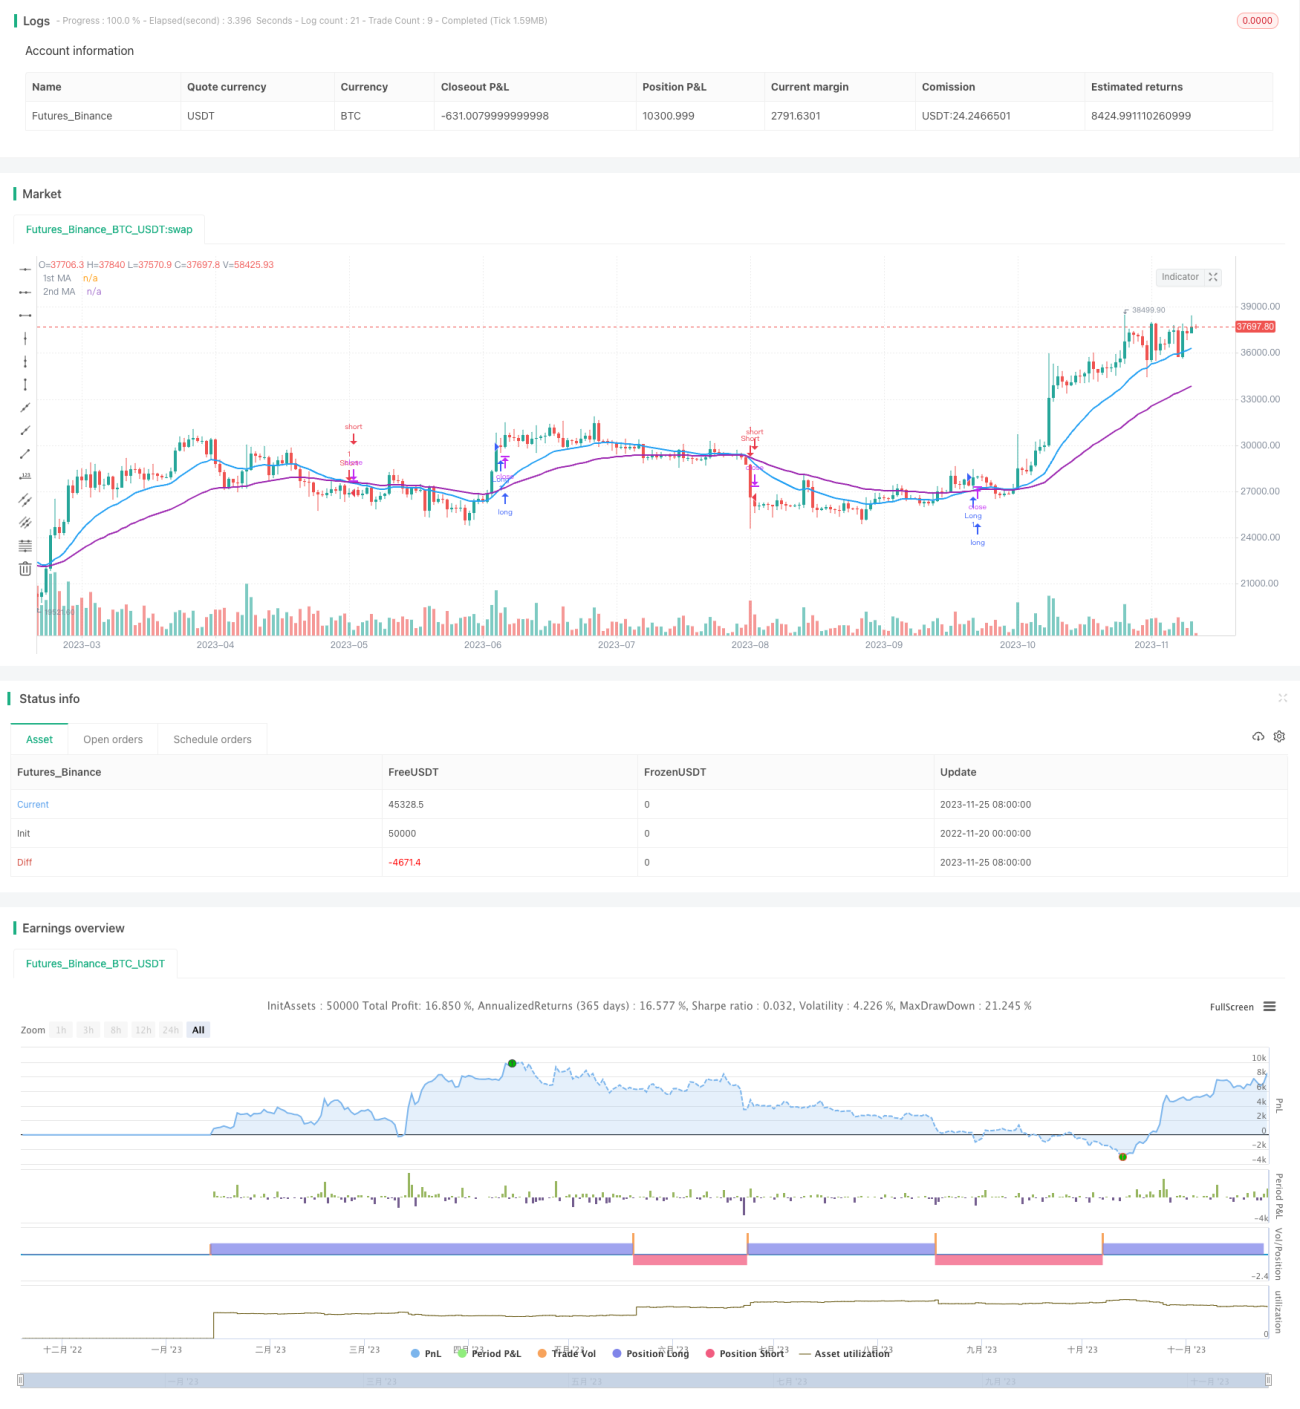
概要
移動平均線交差取引戦略は,異なる周期の移動平均を計算し,金叉または死叉の発生時に買ったり売ったりする,技術分析型の取引戦略に属している.この戦略は,単純で使いやすい,資金占有量が少ない,引き戻しは小さい,中長線操作に適している.
戦略原則
この戦略は,20周期と50周期の指数移動平均 ((EMA) を計算することによって行う. 20周期EMAの上に50周期EMAを穿越したときの買取操作を行う. 20周期EMAの下の50周期EMAを穿越したときの売り込み操作を行う.
EMA指数指数移動平均は,最近のデータに重み付けている.EMAの計算式は:
EMAtoday = (Pricetoday * k) + EMAyesterday * (1-k)
k = 2/ (周期数+1) で
このように,短期のEMA上に長期のEMAを突破すると,価格動向がブルイッシュ,LONG;短期のEMAの下に長期のEMAを突破すると,価格動向がベアリス,SHORT。
優位分析
この戦略の利点は以下の通りです.
- 操作は簡単で理解し実行するのも簡単です.
- 資金の占有が少なく,資金の回収が少なく,資金管理に有利である.
- パラメータの調整は柔軟で,異なる市場向けにカスタマイズできます.
- 日内取引とトレンド取引に適した,あらゆる品種に適用できます.
リスクと最適化
この戦略には以下のリスクもあります.
- 価格の波動は,頻繁に取引のシグナルが発生し,フィルタリング手段を考慮する必要があります.
- 破綻した取引先で取引を停止する際には,ストップ・ロスを考慮する必要があります.
- 取引はパラメータの最適化に悩まされ,より多くの歴史データ検証が必要である.
この戦略は,以下の点で最適化できます.
- 偽信号を減らすために,ブリンライン指標などのフィルターを追加します.
- ストップ・ストップ・ダストの論理に加わり, 牢屋に閉じ込められずに済みます.
- 異なる品種に対して最適なパラメータの組み合わせを探します.
- 取引量指数などと組み合わせた確認買い売り信号.
要約する
移動平均クロスライン取引戦略は,理解し,実行し,市場テストを経て容易に実行できる,シンプルで効果的な技術的な取引戦略の1つである.パラメータ最適化,補助条件の追加などの手段によって,取引リスクをさらに軽減し,戦略の安定性を向上させることができる.この戦略は,量化取引の基本的なモジュールになることができる.
Source
Pine
Strategy parameters
Related strategies
Comment
All comments (0)
No data
- 1