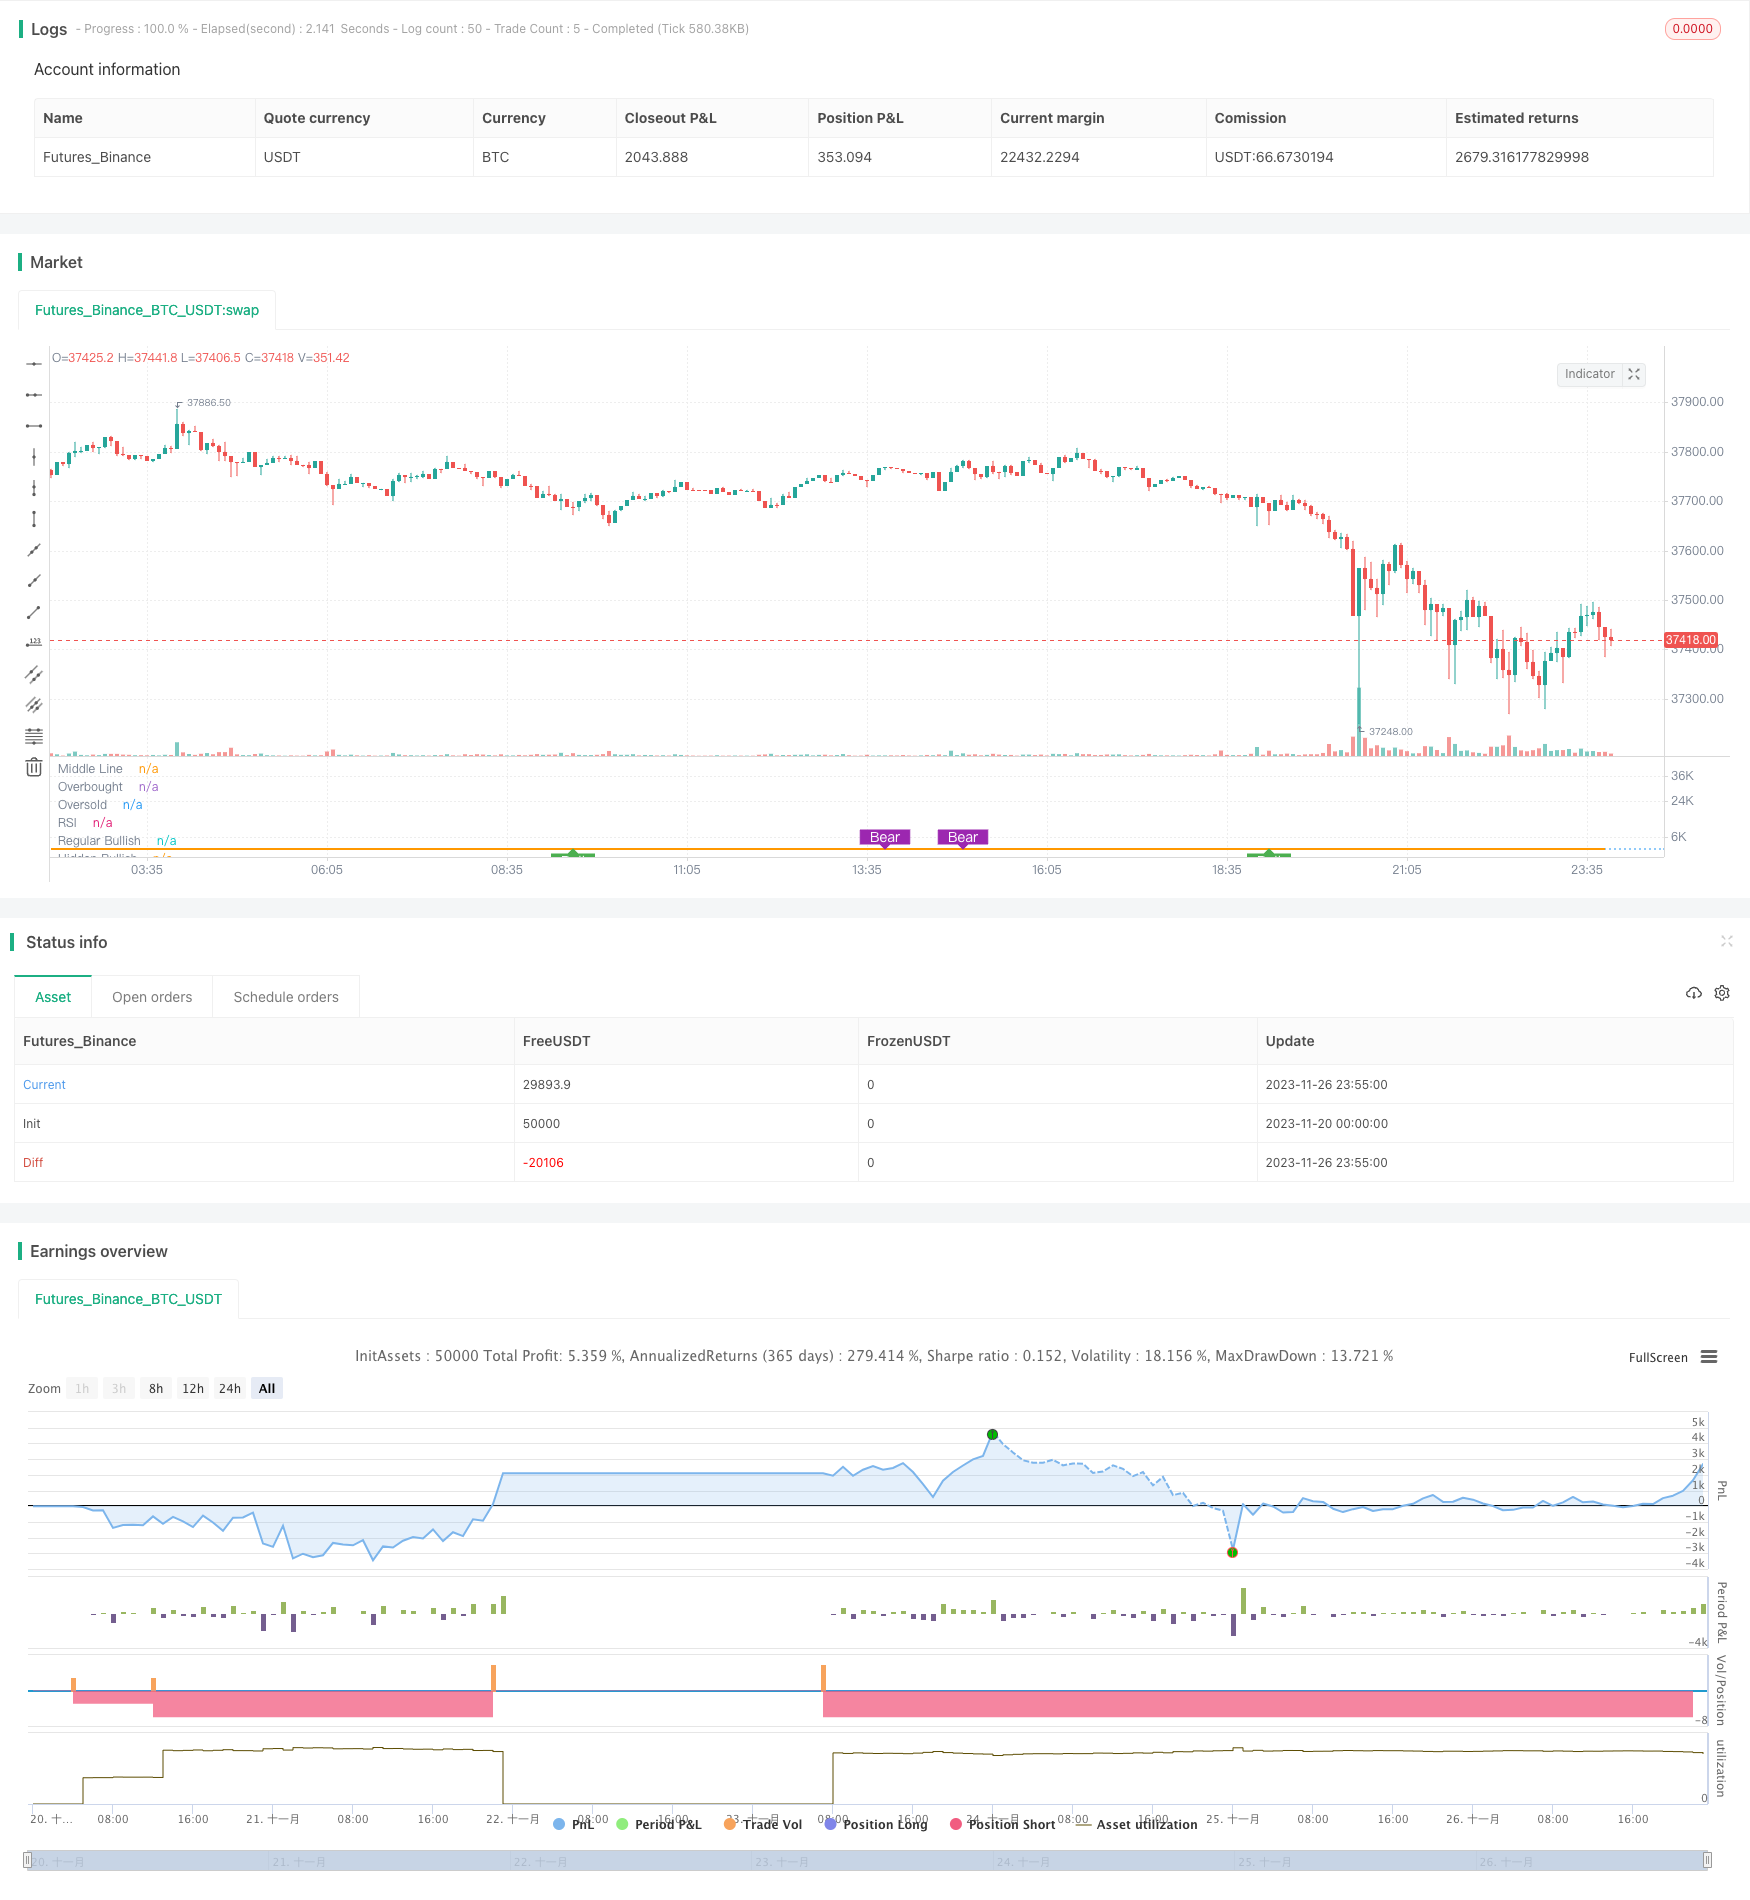
転換点に基づくRSIダイバージェンス戦略

概要
この戦略は,ピボットベースのRSIダイバージェンスの戦略と呼ばれています.これは,RSI指標の周期的なダイバージェンスを使用して,買入販売のポイントを判断し,その基礎で長線RSIをフィルター条件として追加し,戦略の安定性を向上させます.
戦略原則
この戦略は,主に短線RSI ((5日RSIのような) と価格が隠し型多頭背離または常型多頭背離の出現時に買い機会;隠し型空頭背離または常型空頭背離の出現時に売り機会を判断する.
常規型多頭逆とは,価格創出が低いが,RSI創出が低いことを指す.隠された多頭逆とは,価格創出が低いが,RSI創出が低いことを指す.両者の定義における新低と新高は,一定のローリングウィンドウの歴史的極値に対してである.
さらに,戦略は,長線RSI ((50日RSIなど) をフィルター条件として導入する.長線RSIが50以上である場合にのみ,買入シグナルを考慮する.長線RSIが30未満である場合に,ストップ・ロスを考慮する.
戦略的優位性
この策略の最大の利点は,短線RSIの偏差信号と長線RSIのフィルタリングを同時に利用することであり,ある程度はセットされ,行情を逃すことができる.具体的には,主に以下のいくつかの利点を有している.
- ショートラインのRSIは,反転の可能性を予測し,トレンドの転換点を把握します.
- 長線RSIフィルター条件は,トレンドが不確実なときに盲目で多額の取引を避けるため,
- 複数のタイプの止法により,止を分量することで,リスクを減らすことができます.
- ピラミッドの仕組みは,利潤の余地を増やすために,ポジションを増やすことを可能にします.
戦略リスク
この戦略にはいくつかのリスクがあります.
- RSIの偏差は常に有効ではなく,偽信号が発生する可能性があります.
- 投資先の利益は,投資先の利益に左右される.
- 停止装置の設定が不適切である場合,早めに停止したり,利益が不足したりする可能性があります.
対応するリスク管理策には,合理的なストップ・ストップ条件の設定,各ポジションのサイズ制御,負債の曲線を平らにするため,ポジションを減量する等が含まれます.
最適化の方向
この戦略をさらに改善する余地があります.
- RSIパラメータは,最適のパラメータの組み合わせを見つけるためにさらに最適化できます.
- MACD,KDなどの他の指標の偏差信号をテストできます.
- 特定の品種 (例えば,原油,貴金属など) に特化して最適化できるパラメータで,適応性を高めることができる.
要約する
この戦略は,短線と長線RSIの多空偏離信号を総合的に使用し,リスクを制御しながら,利益の効率性を向上させる.これは,入場,出場,散策,ストップ・ロスを設定するなど,量化取引戦略の設計の複数の原則を体現している.これは,参考に参考にすべきRSI偏離戦略の例である.
/*backtest
start: 2023-11-20 00:00:00
end: 2023-11-27 00:00:00
period: 5m
basePeriod: 1m
exchanges: [{"eid":"Futures_Binance","currency":"BTC_USDT"}]
*/

// This source code is subject to the terms of the Mozilla Public License 2.0 at https://mozilla.org/MPL/2.0/
// © mohanee

//@version=4

//GOOGL setting  5 ,50 close, 3 , 1  profitLevel at 75 and No stop Loss shows win rate 99.03 % profit factor 5830.152

strategy(title="RSI5_50 with Divergence", overlay=false,pyramiding=2, default_qty_type=strategy.fixed, default_qty_value=3,    initial_capital=10000, currency=currency.USD)

len = input(title="RSI Period", minval=1, defval=5)
longRSILen = input(title="Long RSI Period", minval=10, defval=50)
src = input(title="RSI Source", defval=close)
lbR = input(title="Pivot Lookback Right", defval=3)
lbL = input(title="Pivot Lookback Left", defval=1)
takeProfitRSILevel = input(title="Take Profit at RSI Level", minval=50, defval=75)
stopLoss = input(title="Stop Loss%(if checked 8% rule applied)", defval=false)

shortTermRSI = rsi(close,len)
longTermRSI = rsi(close,longRSILen)

rangeUpper = input(title="Max of Lookback Range", defval=60)
rangeLower = input(title="Min of Lookback Range", defval=5)
plotBull = input(title="Plot Bullish", defval=true)
plotHiddenBull = input(title="Plot Hidden Bullish", defval=true)
plotBear = input(title="Plot Bearish", defval=true)
plotHiddenBear = input(title="Plot Hidden Bearish", defval=false)


bearColor = color.purple
bullColor = color.green
hiddenBullColor = color.new(color.green, 80)
hiddenBearColor = color.new(color.red, 80)
textColor = color.white
noneColor = color.new(color.white, 100)


plot(shortTermRSI, title="RSI", linewidth=2, color=#8D1699)
plot(longTermRSI, title="longTermRSI", linewidth=2, color=color.orange)

hline(50, title="Middle Line", linestyle=hline.style_dotted)
obLevel = hline(70, title="Overbought", linestyle=hline.style_dotted)
osLevel = hline(30, title="Oversold", linestyle=hline.style_dotted)
fill(obLevel, osLevel, title="Background", color=longTermRSI >=50 ? color.green:color.purple, transp=65)  // longTermRSI >=50

plFound = na(pivotlow(shortTermRSI, lbL, lbR)) ? false : true
phFound = na(pivothigh(shortTermRSI, lbL, lbR)) ? false : true

_inRange(cond) =>
    bars = barssince(cond == true)
    rangeLower <= bars and bars <= rangeUpper

//------------------------------------------------------------------------------
// Regular Bullish

// shortTermRSI: Higher Low
oscHL = shortTermRSI[lbR] > valuewhen(plFound, shortTermRSI[lbR], 1) and _inRange(plFound[1])

// Price: Lower Low
priceLL = low[lbR] < valuewhen(plFound, low[lbR], 1)

bullCond = plotBull and priceLL and oscHL and plFound

plot(
	 plFound ? shortTermRSI[lbR] : na,
	 offset=-lbR,
	 title="Regular Bullish",
	 linewidth=2,
	 color=(bullCond ? bullColor : noneColor),
	 transp=0
	 )


plotshape(
	 bullCond ? shortTermRSI[lbR] : na,
	 offset=-lbR,
	 title="Regular Bullish Label",
	 text=" Bull ",
	 style=shape.labelup,
	 location=location.absolute,
	 color=bullColor,
	 textcolor=textColor,
	 transp=0
	 )

//------------------------------------------------------------------------------
// Hidden Bullish

// shortTermRSI: Lower Low
oscLL = shortTermRSI[lbR] < valuewhen(plFound, shortTermRSI[lbR], 1) and _inRange(plFound[1])

// Price: Higher Low
priceHL = low[lbR] > valuewhen(plFound, low[lbR], 1)

hiddenBullCond = plotHiddenBull and priceHL and oscLL and plFound

plot(
	 plFound ? shortTermRSI[lbR] : na,
	 offset=-lbR,
	 title="Hidden Bullish",
	 linewidth=2,
	 color=(hiddenBullCond ? hiddenBullColor : noneColor),
	 transp=0
	 )

plotshape(
	 hiddenBullCond ? shortTermRSI[lbR] : na,
	 offset=-lbR,
	 title="Hidden Bullish Label",
	 text=" H Bull ",
	 style=shape.labelup,
	 location=location.absolute,
	 color=bullColor,
	 textcolor=textColor,
	 transp=0
	 )

longCondition= longTermRSI >=50  and ( (bullCond or hiddenBullCond ) )  or  (strategy.position_size>0 and crossover(shortTermRSI,20) )
//last condition above is to leg in if you are already in the Long trade,


strategy.entry(id="RSIDivLE", long=true,  when=longCondition)


//------------------------------------------------------------------------------
// Regular Bearish

// shortTermRSI: Lower High
oscLH = shortTermRSI[lbR] < valuewhen(phFound, shortTermRSI[lbR], 1) and _inRange(phFound[1])

// Price: Higher High
priceHH = high[lbR] > valuewhen(phFound, high[lbR], 1)

bearCond = plotBear and priceHH and oscLH and phFound

plot(
	 phFound ? shortTermRSI[lbR] : na,
	 offset=-lbR,
	 title="Regular Bearish",
	 linewidth=2,
	 color=(bearCond ? bearColor : noneColor),
	 transp=0
	 )

plotshape(
	 bearCond ? shortTermRSI[lbR] : na,
	 offset=-lbR,
	 title="Regular Bearish Label",
	 text=" Bear ",
	 style=shape.labeldown,
	 location=location.absolute,
	 color=bearColor,
	 textcolor=textColor,
	 transp=0
	 )

//------------------------------------------------------------------------------
// Hidden Bearish

// shortTermRSI: Higher High
oscHH = shortTermRSI[lbR] > valuewhen(phFound, shortTermRSI[lbR], 1) and _inRange(phFound[1])

// Price: Lower High
priceLH = high[lbR] < valuewhen(phFound, high[lbR], 1)

hiddenBearCond = plotHiddenBear and priceLH and oscHH and phFound

plot(
	 phFound ? shortTermRSI[lbR] : na,
	 offset=-lbR,
	 title="Hidden Bearish",
	 linewidth=2,
	 color=(hiddenBearCond ? hiddenBearColor : noneColor),
	 transp=0
	 )

plotshape(
	 hiddenBearCond ? shortTermRSI[lbR] : na,
	 offset=-lbR,
	 title="Hidden Bearish Label",
	 text=" H Bear ",
	 style=shape.labeldown,
	 location=location.absolute,
	 color=bearColor,
	 textcolor=textColor,
	 transp=0
	 )


//calculate stop Loss
stopLossVal = stopLoss==true ? ( strategy.position_avg_price -  (strategy.position_avg_price*0.08) ) : 0

//partial profit
strategy.close(id="RSIDivLE", comment="TP1", qty=strategy.position_size*3/4, when=strategy.position_size>0 and (longTermRSI>=takeProfitRSILevel or crossover(longTermRSI,90)))
strategy.close(id="RSIDivLE",comment="TP2",   qty=strategy.position_size*3/4 , when=crossover(longTermRSI,70))
strategy.close(id="RSIDivLE",comment="TP3",   qty=strategy.position_size/2, when=crossover(longTermRSI,65))
strategy.close(id="RSIDivLE",comment="TP4",   qty=strategy.position_size/2 , when=crossover(longTermRSI,60))

//close the whole position when stoploss hits or longTermRSI goes below 30
strategy.close(id="RSIDivLE",comment="Exit",    when=crossunder(longTermRSI,30) or close<stopLossVal)