モメンタム商品選択指数戦略

概要
動量商品選択指数 (CSI) 戦略は,市場の動力を追跡するショートライン取引戦略である.それは,商品の傾向性と波動性を計算して,強力な動量を持つ商品を識別するために取引する.この戦略は,ウェルズ・ワイルダー (Welles Wilder) が彼の新技術分析取引システム概念<unk>で提唱した.
戦略原則
この戦略の核心指標はCSI指数で,商品のトレンド性と変動性を総合的に考慮している.具体的には以下の計算方法があります.
CSI = K × ATR × (ADX + ADXのn日平均線) /2)
その中で,Kは縮小系数であり,ATRは市場の波動性を測定する平均実際の波動幅を表す.ADXは市場の傾向性を反映する平均方向指数を表す.
各商品のCSI指数値を計算し,n日間の単純移動平均線と比較することで,CSIが移動平均線より高くなったら買い,CSIが移動平均線より低かったら売るシグナルが生成される.
この戦略は,CSI指数が高い商品を取引する.これらの商品は,強い傾向性および変動性があるため,短期間により大きな利益の可能性を得ることができます.
優位分析
この戦略には以下の利点があります.
- 商品のトレンド性や波動性の特性を活用する.
- 双重指数は,取引信号をより信頼性のあるものにします.
- 自動化された取引に適した,シンプルで明確な取引ルール
- 短線取引に特化して設計されていて,短期間の機会を迅速に把握できます.
リスク分析
この戦略にはいくつかのリスクがあります.
- 電子機器の技術的な指標に過度に依存すると,誤信号が発生する可能性があります.
- 動力を追跡する特性により,短線操作のみに適している.
- 波動が大きすぎると,ストップ・ロスが起こり,取引に損失が及ぶ可能性があります.
- 投資家は,その投資の利害を考慮して,より大きな資金リスクを負う必要があります.
リスクを制御するために,合理的にストップ・ポジションを設定し,単一のポジションのサイズを制御し,異なる市場環境に対応するためにパラメータを適切に調整する必要があります.
最適化の方向
この戦略は以下の点で最適化できます.
- 複数のパラメータの組み合わせをテストし,最適なパラメータを探します.
- 他の補助指標と合わさって信号をフィルターする.
- 波動率の逆転などの他の戦略と組み合わせた組み合わせ.
- 機械学習の訓練モデルを用いて,より信頼性の高い取引信号を生成する.
要約する
動量商品選択指数戦略は,市場における傾向が強い,波動性が大きい商品を捕捉することによって,簡易で迅速な短線取引を実現する.この動量を追跡する方法は,その信号を明確にして,自動化を容易に実施する.もちろん,リスク管理に注意を払い,市場環境の変化に適応するために継続的に改良・アップグレードする必要がある.
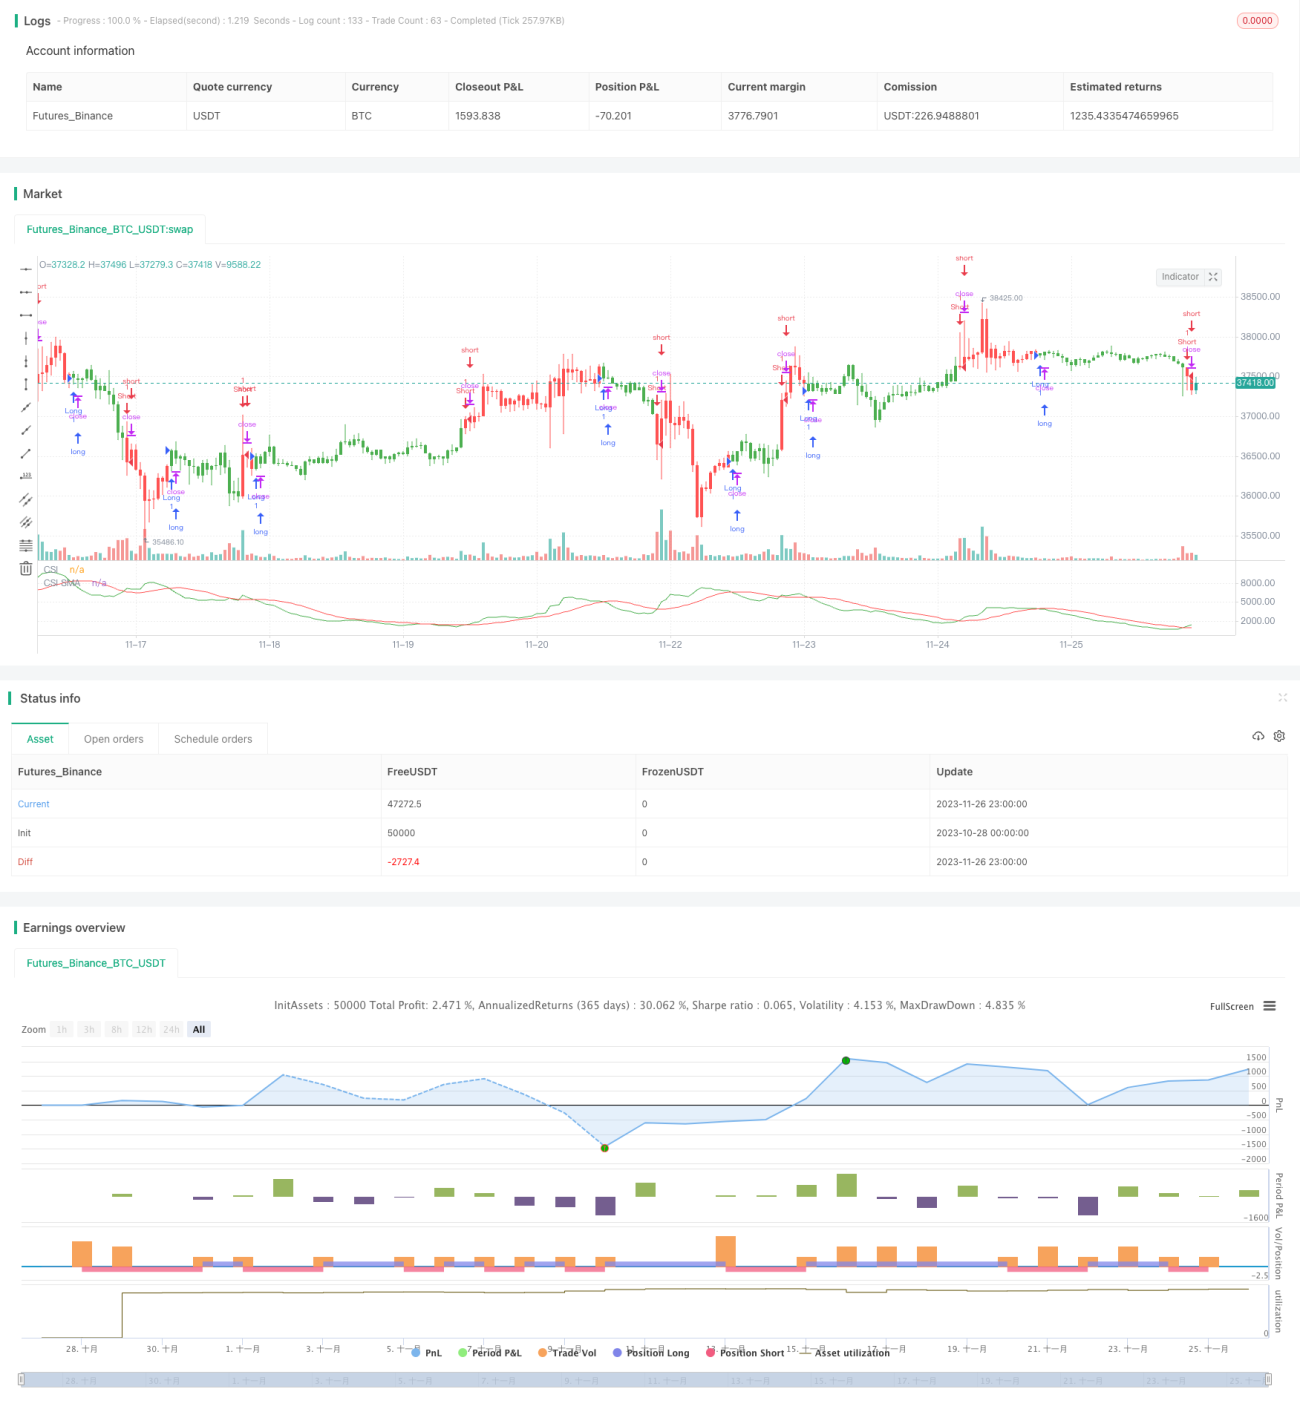
/*backtest
start: 2023-10-28 00:00:00
end: 2023-11-27 00:00:00
period: 1h
basePeriod: 15m
exchanges: [{"eid":"Futures_Binance","currency":"BTC_USDT"}]
*/

//@version=3
////////////////////////////////////////////////////////////
//  Copyright by HPotter v1.0 20/03/2019
// The Commodity Selection Index ("CSI") is a momentum indicator. It was - 1