過去のデータに基づく動的なサポートとレジスタンス戦略

概要
この戦略は,歴史上の高点,低点,および閉店価格の動的計算に基づいて,サポートレジスタンス位置を得て,取引シグナルを生成します. この戦略は,中長期ラインのポジションに適用され,市場におけるサポートレジスタンスを効果的に利用して利益を得ることができます.
戦略原則
-
前回期の最高価格,最低価格,閉盘価格の平均値を計算して,基準点PPを得る.
-
S1 = 2 の 3 つの支柱を計算します.PP - 最高価格;S2 = PP - (R1-S1);S3 = 最低価格 - 2(最高価格=PP) でした
-
R1 = 2 の3つの抵抗線を計算します.PP - 最低価格;R2 = PP + (R1-S1);R3 = 最高価格 + 2(PP - 最安値) でした.
-
価格がレジスタンスラインを上越したとき,多めに;価格がサポートラインを下越したとき,空っぽに.
優位分析
-
市場構造をリアルタイムに捉えるための,歴史データに基づくサポート・レジスタンス位の変化の動態.
-
多層のサポートレジスタンス設定により,リスク管理の最適化が可能である.
-
簡単な直感的な取引シグナルとストップ・ロスの方法
リスク分析
-
変動が激しい状況では,歴史的なデータで提供された基準価格は失効する可能性があります.
-
多空間の間の切り替えは取引コストを考慮する必要があります.
-
データの品質を保証し,計算の誤りを避ける必要があります.
最適化の方向
-
百日線など,もっと歴史的なデータからの参考文献を導入することも考えられます.
-
ポジション管理の最適化,例えば変動率に基づくポジション比率の調整
-
ストップ・トラッキングや資金管理のストップ・ストップのようなストップ・ストラテジーを追加する.
要約する
この戦略は,歴史的サポートレジスタンス概念に基づいて,複数のレベルの基準価格を提供します.戦略はシンプルで直接で,中長期のポジションを保持して利益を得るのに適しています.同時に,高度に波動的な市場のリスクと取引コストの制御にも注意する必要があります.さらなる最適化により,戦略は複雑な環境で安定的に動作させることができます.
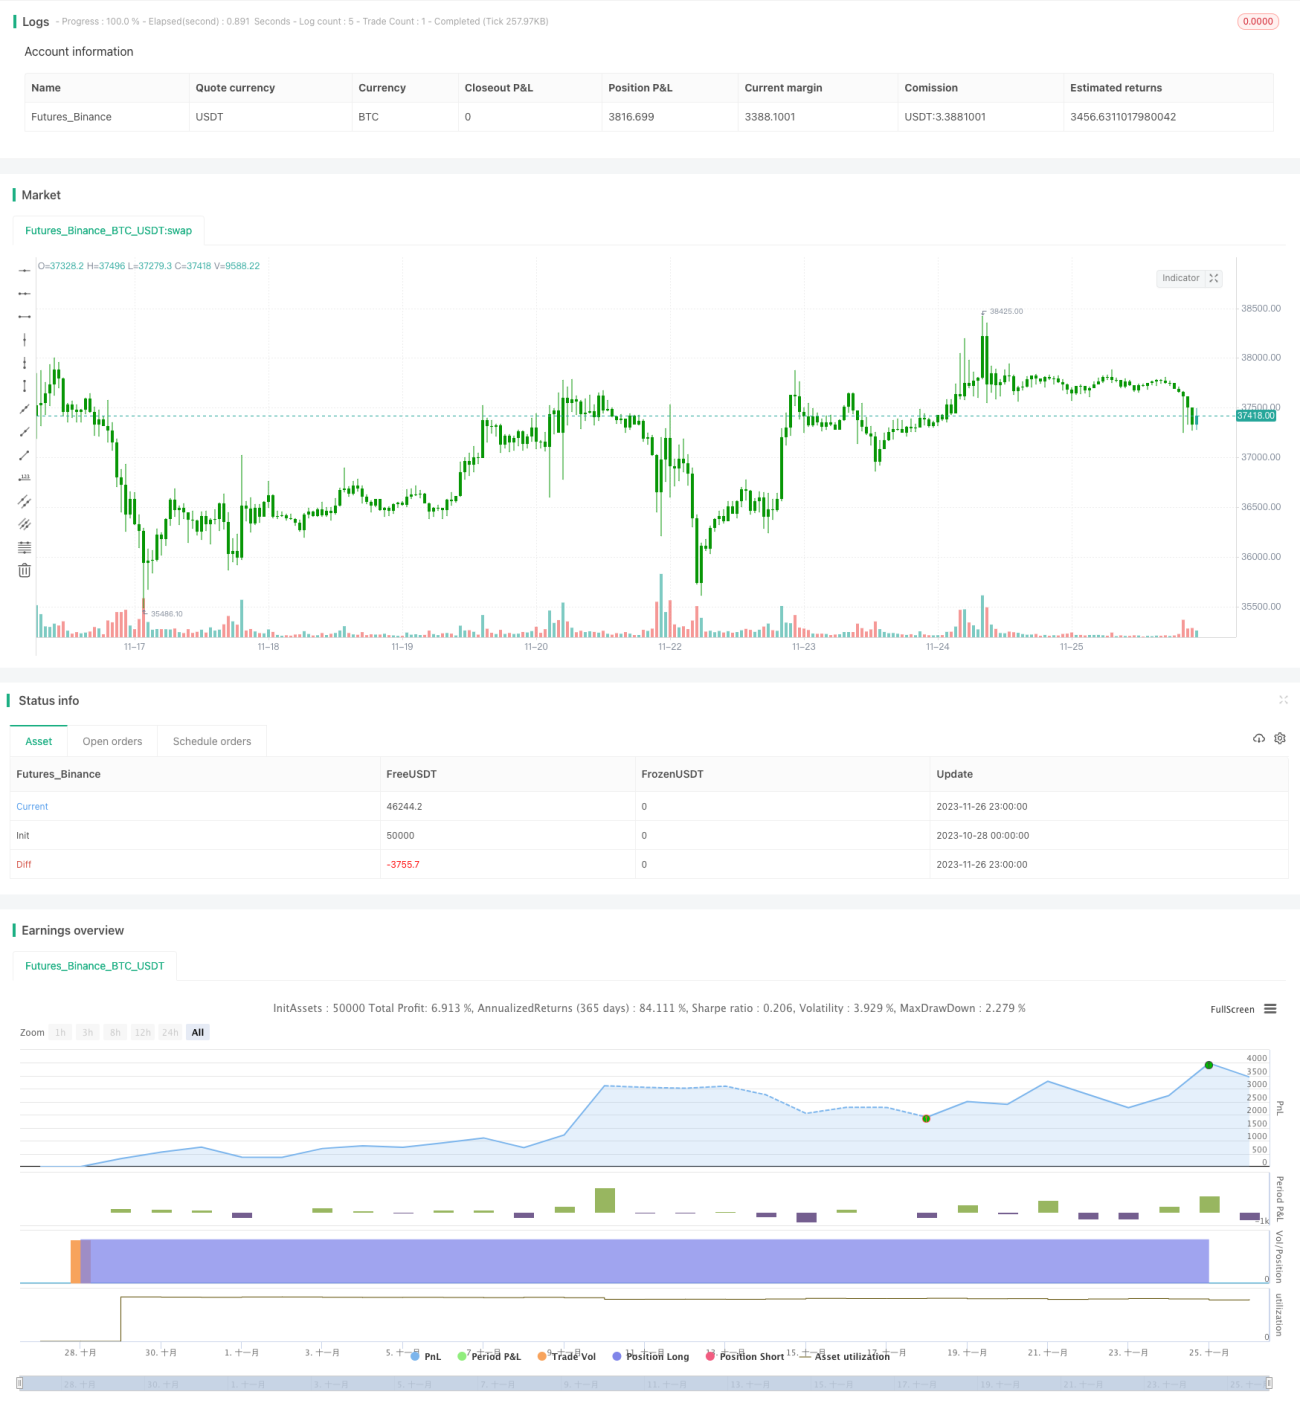
/*backtest
start: 2023-10-28 00:00:00
end: 2023-11-27 00:00:00
period: 1h
basePeriod: 15m
exchanges: [{"eid":"Futures_Binance","currency":"BTC_USDT"}]
*/

//@version=4
////////////////////////////////////////////////////////////
//  Copyright by HPotter v1.0 09/06/2020
// Pivot points simply took the high, low, and closing price from the previous period and - 1