複数の時間枠に基づく定量的スイングトレード戦略


作成日: 2023-12-01 13:50:02 最終変更日: 2023-12-01 13:50:02
コピー: 0 クリック数: 767
1
フォロー
1619
フォロワー

複数の時間枠に基づく定量的スイングトレード戦略

概要

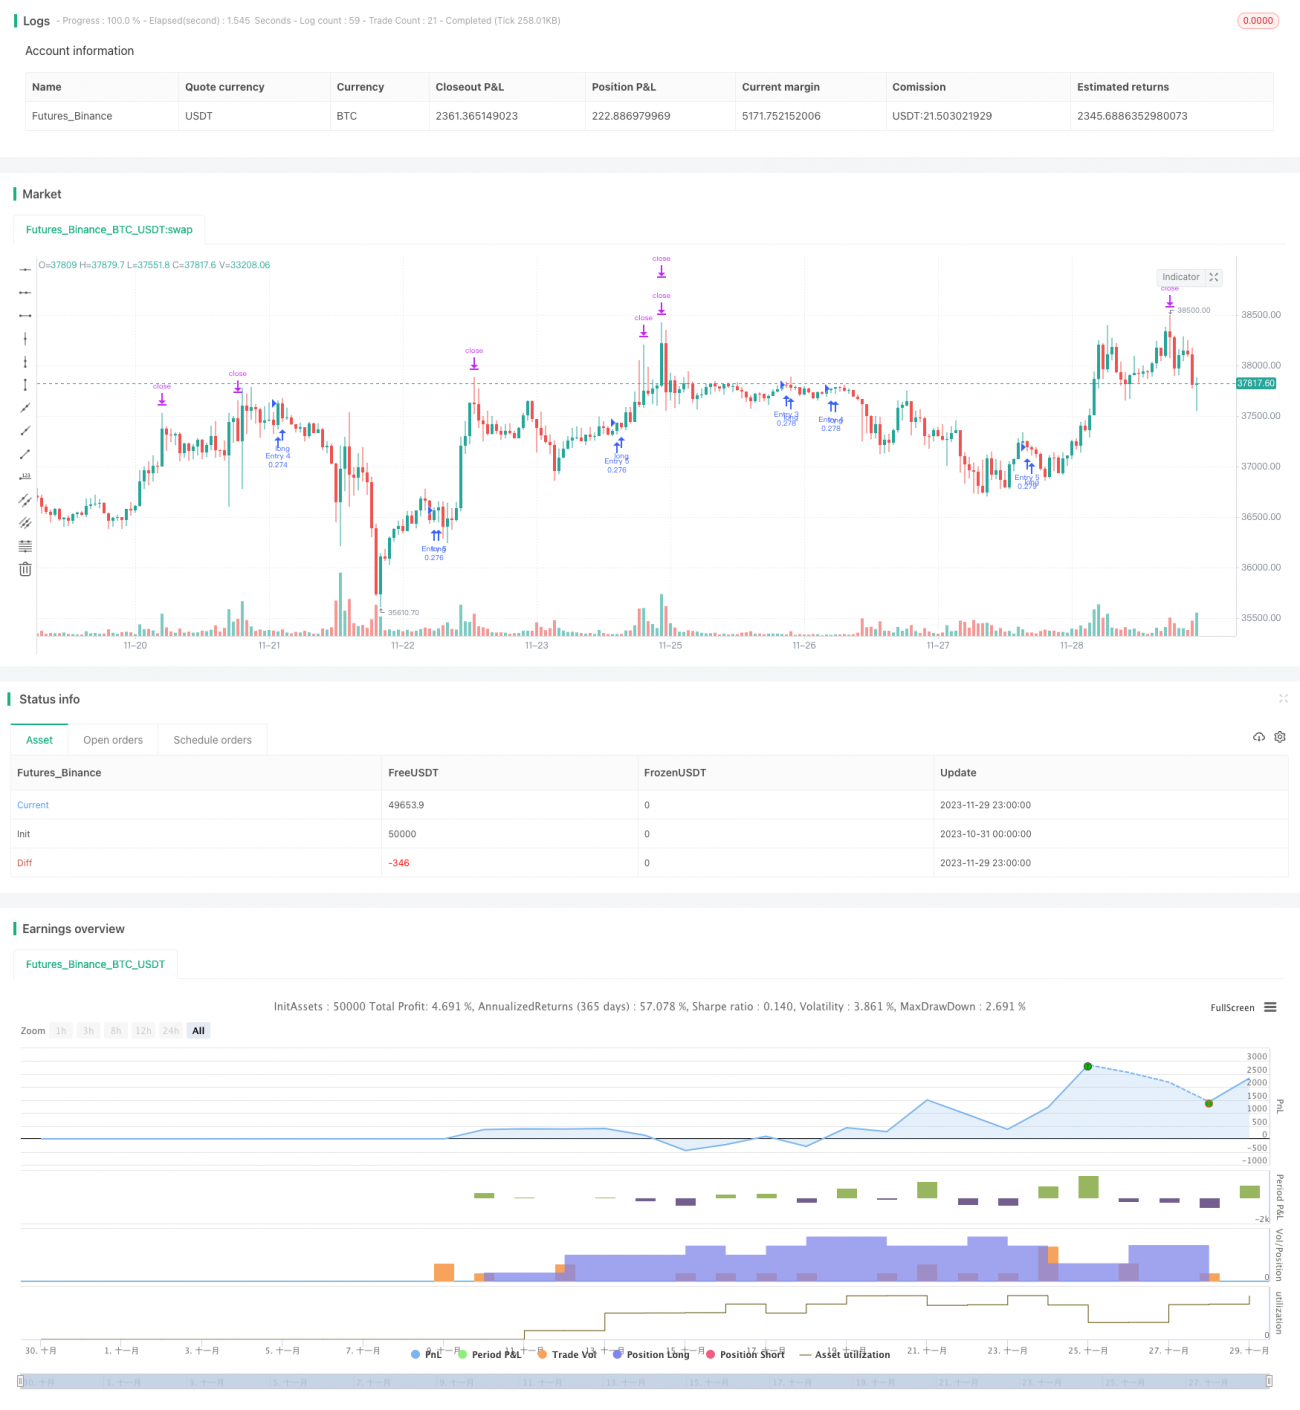
この戦略は,異なる時間枠内の定量指標を組み合わせて,ビットコインの価格帯の識別を実現し,取引を追跡する.戦略は5分間の時間枠を採用し,長期にわたって波段を保持して利益を得る.

戦略原則

  1. RSIは日経時間枠をベースに計算され,取引量で加重計算され,偽突破をフィルターします.
  2. 日線RSI指数にEMA平滑処理を行い,定量波段指数を構築する.
  3. 5分間の時間枠は,線形回帰指数とHMA指数を使用して取引信号を構築する.
  4. 戦略は,波段の指標と取引信号の組み合わせを量化して,異なる時間枠間の結合を実現し,価格の中央の長線波段を識別する.

優位分析

  1. 取引量加重のRSI指標を用いて,真波段を効果的に識別し,偽突破をフィルターします.
  2. HMAの指標は価格の変化に敏感で,転換をすぐに捉える.
  3. 複数の時間枠を組み合わせることで,中長線波段をより正確に識別できます.
  4. 5分間の時間枠で取引し,より高い操作頻度で取引する.
  5. 波段追跡策略は,精確に選択する必要なく,より長く保持できます.

リスク分析

  1. 定量化指標は誤った信号を発する可能性があるので,基本的分析と組み合わせることをお勧めします.
  2. 波段は中途半端に逆転する可能性があるので,止損退出メカニズムを設定すべきである.
  3. 取引信号が遅れて,ベストエントリーポイントを逃したかもしれない.
  4. 利潤波は長期にわたって保有され,一定の資金圧力を負う必要があります.

最適化の方向

  1. 異なるパラメータのRSI指標の効果をテストする.
  2. 他の補助波段の指標を導入してみてください.
  3. HMA指標の長さのパラメータを最適化する.
  4. ストップ・ロズとストップ・ストップの戦略を追加する.
  5. 帯域取引の持有周期を調整する.

要約する

この戦略は,複数の時間枠の組み合わせと波段の追跡方法によって,ビットコインの中間長線トレンドの効果的なキャプチャを実現している.短線取引と比較して,中間長線波段の取引の引き戻しは小さい,利益の余地が大きい.次に,パラメータ調整とリスク管理戦略の追加により,戦略の収益率と安定性をさらに向上させる見込みである.

ストラテジーソースコード
/*backtest
start: 2023-10-31 00:00:00
end: 2023-11-30 00:00:00
period: 1h
basePeriod: 15m
exchanges: [{"eid":"Futures_Binance","currency":"BTC_USDT"}]
*/

//@version=4

strategy(title='Pyramiding BTC 5 min', overlay=true, pyramiding=5, initial_capital=10000, default_qty_type=strategy.percent_of_equity, default_qty_value=20, commission_type=strategy.commission.percent, commission_value=0.075)
//the pyramide based on this script  https://www.tradingview.com/script/7NNJ0sXB-Pyramiding-Entries-On-Early-Trends-by-Coinrule/
//
fastLength = input(250, title="Fast filter length ", minval=1)
slowLength = input(500,title="Slow filter length",  minval=1)
source=close
v1=ema(source,fastLength)
v2=ema(source,slowLength)
//
//Backtest dates
fromMonth = input(defval=1, title="From Month")
fromDay = input(defval=10, title="From Day")
fromYear = input(defval=2020, title="From Year")
thruMonth = input(defval=1, title="Thru Month")
thruDay = input(defval=1, title="Thru Day")
thruYear = input(defval=2112, title="Thru Year")

showDate = input(defval=true, title="Show Date Range")

start = timestamp(fromYear, fromMonth, fromDay, 00, 00)  // backtest start window
finish = timestamp(thruYear, thruMonth, thruDay, 23, 59)  // backtest finish window
window() =>  // create function "within window of time"
    time >= start and time <= finish ? true : false


leng=1
p1=close[1]

len55 = 10
//taken from https://www.tradingview.com/script/Ql1FjjfX-security-free-MTF-example-JD/
HTF = input("1D", type=input.resolution)
ti = change( time(HTF) ) != 0
T_c = fixnan( ti ? close : na )

vrsi = rsi(cum(change(T_c) * volume), leng)
pp=wma(vrsi,len55)

d=(vrsi[1]-pp[1])
len100 = 10
x=ema(d,len100)
//
zx=x/-1
col=zx > 0? color.lime : color.orange

//

tf10 = input("1", title = "Timeframe", type = input.resolution, options = ["1", "5", "15", "30", "60","120", "240","360","720", "D", "W"])

length = input(50, title = "Period", type = input.integer)
shift = input(1, title = "Shift", type = input.integer)

hma(_src, _length)=>
    wma((2 * wma(_src, _length / 2)) - wma(_src, _length), round(sqrt(_length)))
    
hma3(_src, _length)=>
    p = length/2
    wma(wma(close,p/3)*3 - wma(close,p/2) - wma(close,p),p)

b =security(syminfo.tickerid, tf10, hma3(close[1], length)[shift])
//plot(a,color=color.gray)
//plot(b,color=color.yellow)
close_price = close[0]
len = input(25)

linear_reg = linreg(close_price, len, 0)


filter=input(true)

buy=crossover(linear_reg, b)

longsignal = (v1 > v2 or filter == false ) and buy and window()

//set take profit

ProfitTarget_Percent = input(3)
Profit_Ticks = close * (ProfitTarget_Percent / 100) / syminfo.mintick

//set take profit

LossTarget_Percent = input(10)
Loss_Ticks = close * (LossTarget_Percent / 100) / syminfo.mintick


//Order Placing

strategy.entry("Entry 1", strategy.long, when=strategy.opentrades == 0 and longsignal)

strategy.entry("Entry 2", strategy.long, when=strategy.opentrades == 1 and longsignal)

strategy.entry("Entry 3", strategy.long, when=strategy.opentrades == 2 and longsignal)

strategy.entry("Entry 4", strategy.long, when=strategy.opentrades == 3 and longsignal)

strategy.entry("Entry 5", strategy.long, when=strategy.opentrades == 4 and longsignal)


if strategy.position_size > 0
    strategy.exit(id="Exit 1", from_entry="Entry 1", profit=Profit_Ticks, loss=Loss_Ticks)
    strategy.exit(id="Exit 2", from_entry="Entry 2", profit=Profit_Ticks, loss=Loss_Ticks)
    strategy.exit(id="Exit 3", from_entry="Entry 3", profit=Profit_Ticks, loss=Loss_Ticks)
    strategy.exit(id="Exit 4", from_entry="Entry 4", profit=Profit_Ticks, loss=Loss_Ticks)
    strategy.exit(id="Exit 5", from_entry="Entry 5", profit=Profit_Ticks, loss=Loss_Ticks)