高速および低速EMAゴールデンクロスブレイクアウト戦略

1
Follow
1779
Followers
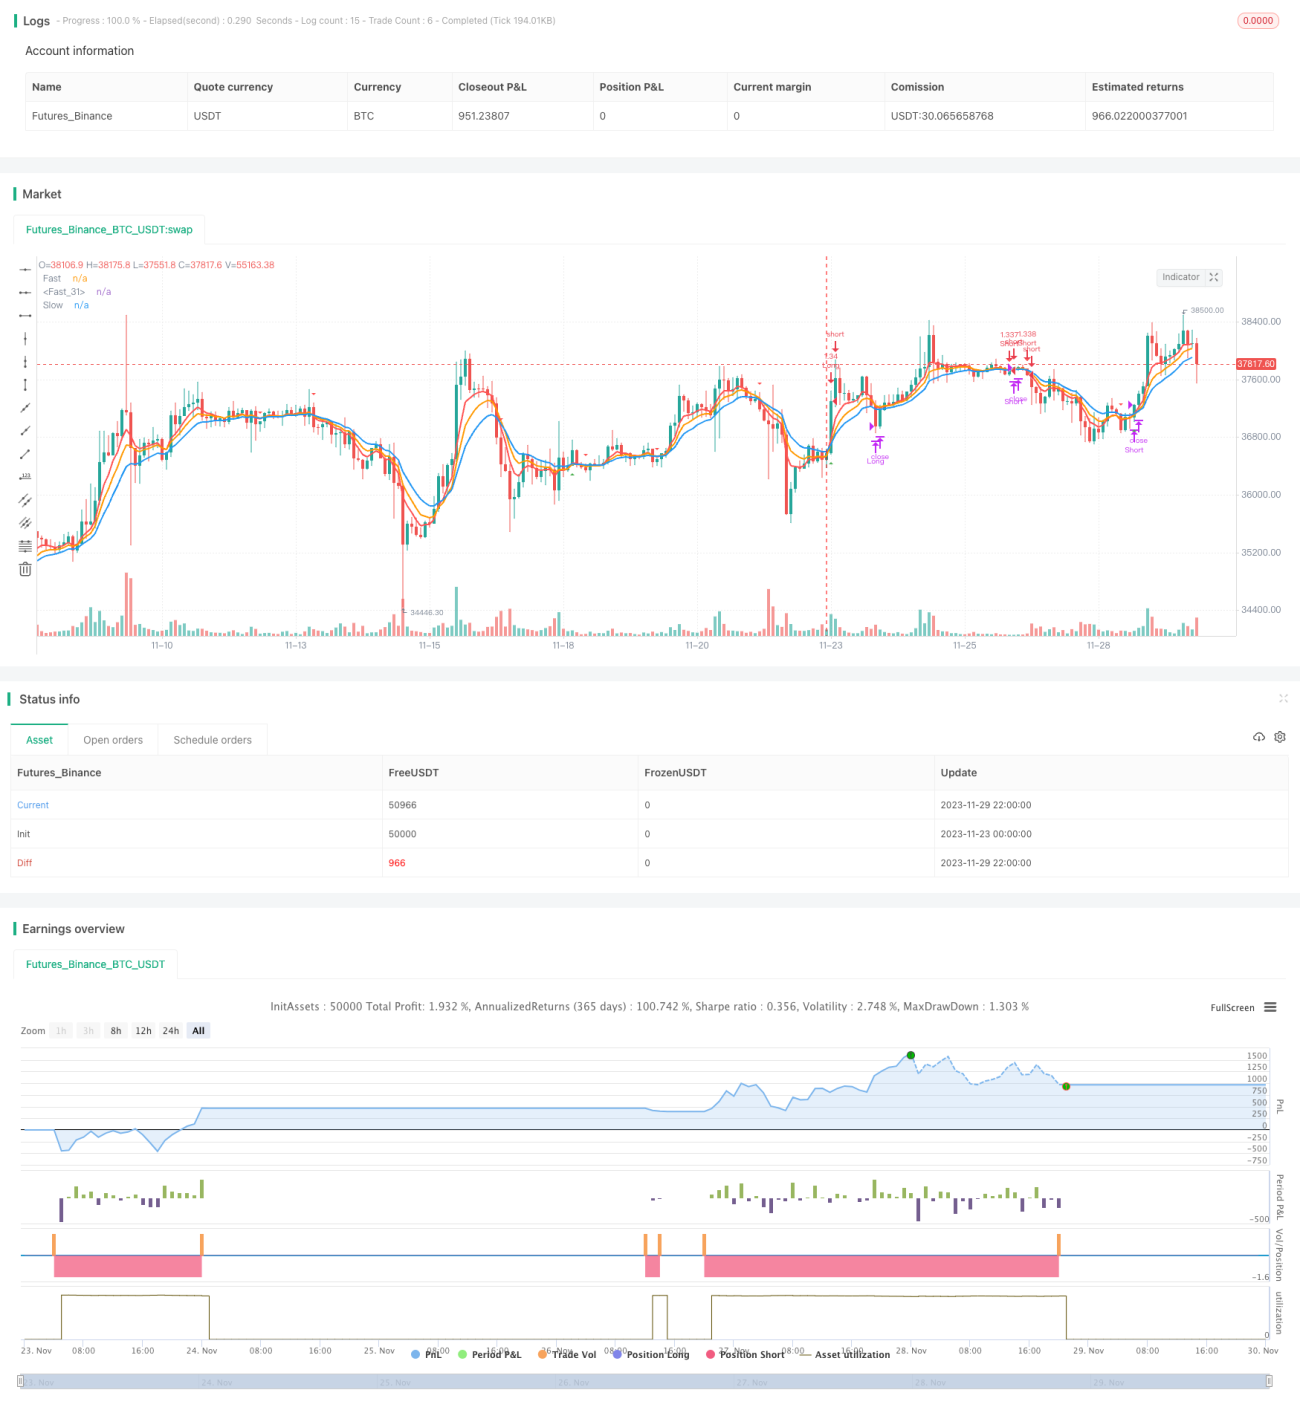
概要
ゆっくりとしたEMA黄金のクロスブレイク戦略は,市場動向を追跡するシンプルで効果的な戦略である.それは,異なる周期のEMA平均線を利用してクロスブレイクを行い,買入と売却のシグナルを生成する.基本的な考え方は,短周期EMAでより長い周期EMAを穿越すると,買入シグナルを生成する.短周期EMAの下でより長い周期EMAを穿越すると,売却シグナルを生成する.
戦略原則
この戦略は主に5周期,8周期および13周期のEMA平均線を比較して取引シグナルを生成する.
- 5サイクルEMA,8サイクルEMAと13サイクルEMAを計算する.
- 5サイクルEMAに8サイクルと13サイクルEMAを穿戴すると,買い信号が生成される。
- 5サイクルEMAの下の8サイクルと13サイクルEMAを穿越すると,セールシグナルが生成される.
- また,ADX指数と組み合わせてトレンドの強さを判断し,トレンドが十分に強ければしか信号が作れない.
このようにして,中長線トレンドを追跡する効果が実現される。短周期平均線上を長周期平均線に横切ると,短期トレンドが多頭に転じ,買えることを示し;短周期平均線下を長周期平均線に横切ると,短期トレンドが空頭に転じ,売るべきことを示し。
優位分析
この戦略の利点は以下の通りです.
- 操作が簡単で実現しやすい.
- EMA平均線の平滑作用を充分活用し,トレンドを効果的に追跡する.
- マルチ EMA ポートフォリオの交差は,偽信号を回避します.
- 信号の信頼性を高めるためにADX指標と組み合わせた.
- 引き下げも最大値も低い.
リスク分析
この戦略にはいくつかのリスクがあります.
- トレンドが急激に逆転すると,止損は大きくなる可能性があります. 止損範囲を適切に緩めることができます.
- 取引頻度が高いため,取引手数料が増加することが容易である.EMAパラメータを適切に調整して取引頻度を低下させることができる.
最適化の方向
この戦略は以下の方向から最適化できます.
- EMAパラメータを最適化して,最適なパラメータの組み合わせを見つけます.
- KDJ,BOLLなどの他の指標のフィルターを追加して,信号の質を向上させる.
- ポジション管理を調整し,リスク管理を最適化します.
- マシン・ラーニングを使って より良い入場・出場ルールを模索する
要約する
概要として,快慢EMA黄金十字突破策略は全体的に順調に動作し,信号は比較的信頼性があり,後退は高くない.中中長線トレンドを追跡するのに適している.パラメータの最適化と規則の完善により,より良い策略効果を得ることができる.
Source
Pine
Strategy parameters
Related strategies
Comment
All comments (0)
No data
- 1