モメンタム価格チャネルのエントリーとエグジット戦略

1
Follow
1779
Followers
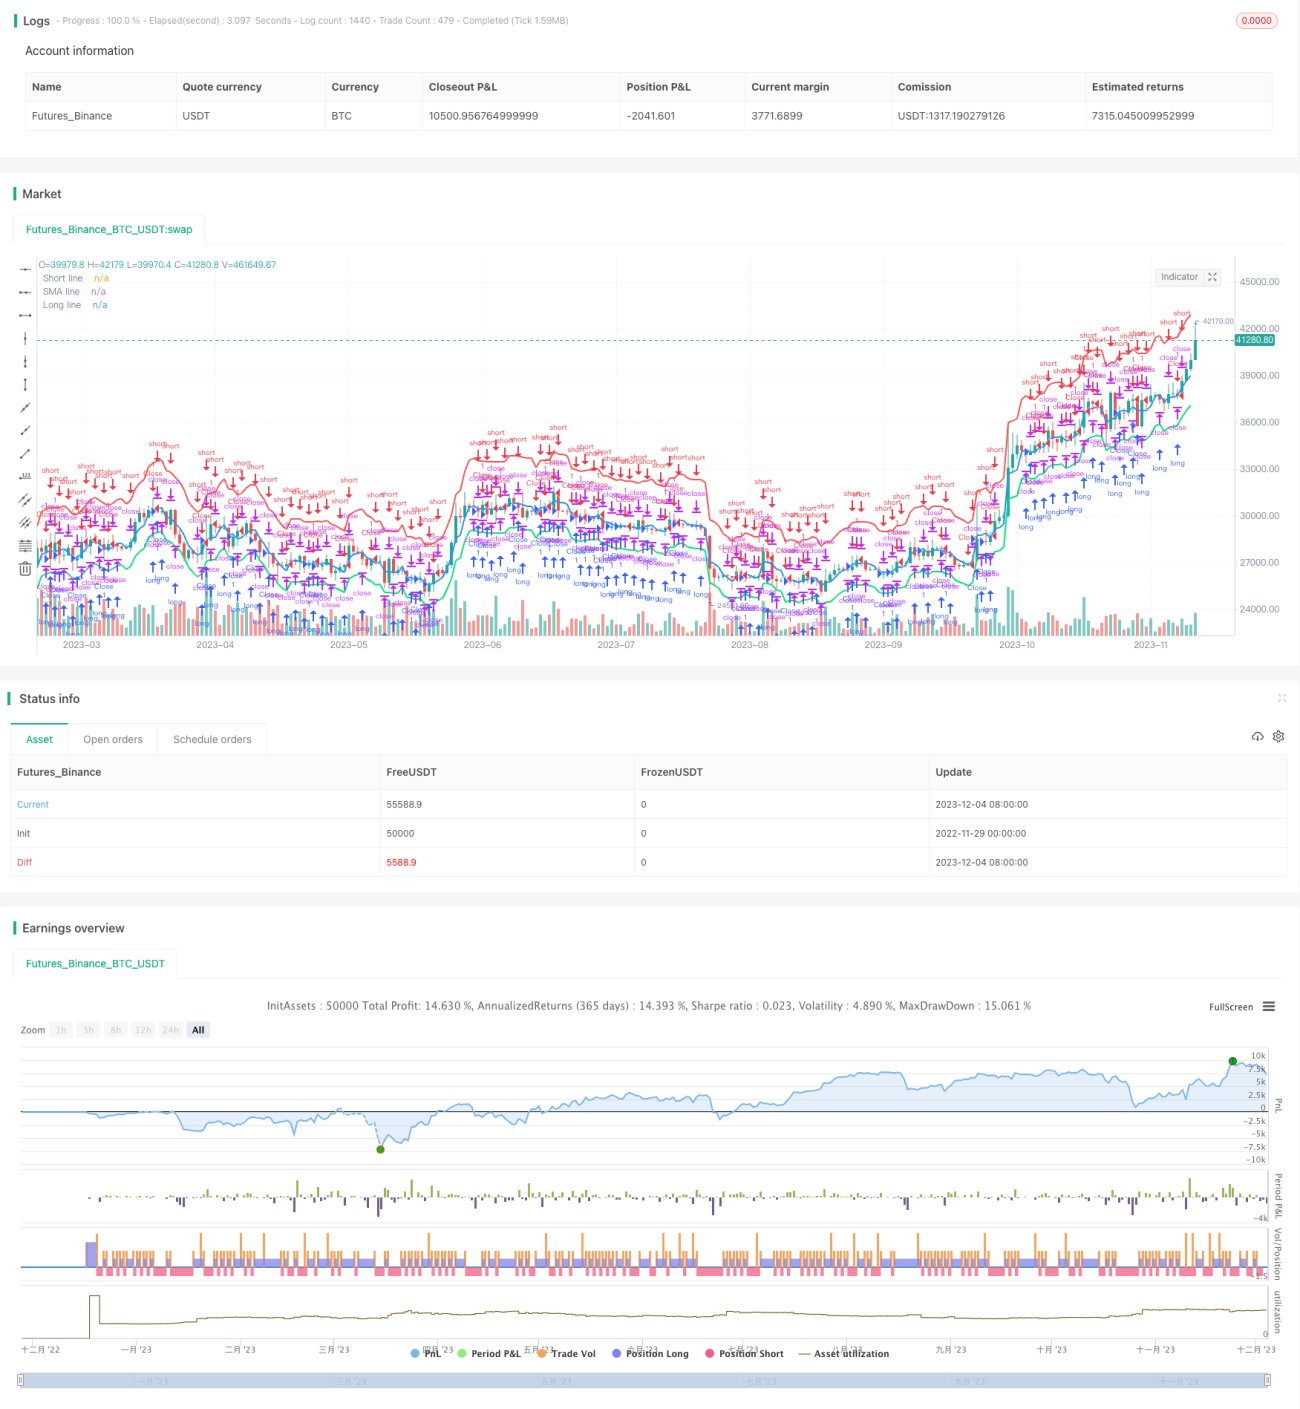
概要
この戦略は,価格チャネル指標に基づいて,動量パラメータを設定し,異なる周期の最高価格と最低価格の平均値を計算することによって,価格チャネルの中線を形成し,これを基準として,長線と短線を設定します. 価格が長線を破るとき,多めに; 価格が短線を破るとき,空いてください.平仓条件は価格のチャネルの中線への戻りです.
戦略原則
この策略は,価格チャネル指標を使用して,異なる周期における最高価格と最低価格の平均値を計算し,価格チャネルの中線を形成する. 中線をベースとして,シフトパラメータを使用して長線と短線を設定する. 具体的には,長線計算の公式は: 中線+(中線×長線パラメータ%); 短線計算の公式は: 中線+(中線×短線パラメータ%) である.
価格が長線より低ければ,限価格単一で多発券を開く.価格が短線より高ければ,限価格単一で空券を開く.多発券の止損方法は,価格の回帰通路の中線である.
優位分析
この戦略の利点は以下の通りです.
- 価格チャネル指標を使用すると,価格トレンドと重要なサポートレジスタンス点を効果的に捉えることができます.
- 破綻記録の方法によってポジションを開設することで,偽破綻による損失を減らすことができます.
- ストップは,価格チャネルの中央線を直接基準として,ストップを追及する過度の損失を避ける方法である.
リスク分析
この戦略にはいくつかのリスクがあります.
- 価格通路のパラメータは正しく設定されず,積極的な動きを見逃したり,偽の突破を過剰に発生させたりする可能性があります.
- 倉庫を開拓する方法は,ある程度渡航コストを伴う.
- 価格が急激に下落している間,その損失を止めることはできない.
上記のリスクは,最適化パラメータ,ストップ・ロードの設定,または他の指標判断と組み合わせて軽減することができます.
最適化の方向
この戦略は以下の点で最適化できます.
- 価格チャネルのパラメータを最適化し,最適な組み合わせを探します.
- K線形,指数多空信号など,異なる開設方法を試す.
- 価格の急激な下落による損失を防ぐため,ストップ・ロードの設定を追加します.
- 取引量,変動率などの指標を組み合わせて,株式市場における偽の突破を避ける.
要約する
この戦略は,価格チャネル指標の設計理念が明確であり,突破開口を使用してリスクを効果的に制御できます。しかし,パラメータ最適化の余地が大きく,止損機構が完善される必要があるなどの問題もあります。全体的に,この戦略には一定の実用価値があり,さらなるテストと最適化の価値があります。
Source
Pine
Strategy parameters
Related strategies
Comment
All comments (0)
No data
- 1