
ダブルインジケーター買入フィルター 買入シグナル戦略は,ランダム指数平滑移動平均 ((Stochastic RSI) とブリン帯の指標の組み合わせを使用して,潜在的な買入機会を識別する.この戦略は,最も有利な買入点を区別するために複数のフィルタリング条件を使用する.これは,市場変動の環境下で,高い確率で買入するタイミングを識別する.
この戦略は,2つの指標を用いて購入の機会を特定します.
まず,ランダム指数平滑移動平均を用いて,市場が超売りであるかどうかを判断する.この指標は,ランダム指数とその平滑移動平均を組み合わせて,%K線が低点から%D線を穿越すると,超売り信号とみなされる.ここで,値が設定され,%K線が20を超えると,超売りとみなされる.
第二に,この戦略は,ブリン帯の指標を使用して価格変化を識別する.ブリン帯は,価格の標準差に基づいて計算される上下軌道である.価格が下下軌道に近づくと,超売り状態である.この戦略は,ここで標準差の2倍のパラメータを設定し,ブリン帯の範囲を大きくし,より多くの偽信号をフィルターする.
上記の2つの指標の超売りシグナルを取得した後,この戦略は,購入のタイミングをさらに識別するために,複数のフィルタリング条件を追加します.
総合判断により識別された買い時であれば,買い信号を発する.
この2つの指標のフィルタリングにはいくつかの利点があります.
全体として,この戦略は,複数の技術指標とフィルタリング手段を統合して,購入のタイミングをより正確で信頼性のある方法で識別し,その結果,より良い取引パフォーマンスを得ています.
この二重指標のフィルタリング戦略には多くの利点がありますが,いくつかのリスクがあります.
この戦略は,上記のリスクに対して,以下の方法で最適化できます.
この二重指標のフィルタリング戦略は,以下のいくつかの側面からさらに最適化できます.
より高度な技術と方法の導入により,この二重指数フィルタリング戦略は,より正確な購入タイミングの選択とより強力なリスク制御能力を得ることができる.その結果,実盤でより安定した信頼性の高い利益を得ることができる.
以上をまとめると,二重指数買入フィルター買入シグナル戦略は,ストキャスティックRSIとブリン帯などの複数の技術指標を使用し,価格強度と回転判断などの複数のフィルタリング条件を組み合わせて,高い確率で信頼できる買入のタイミングを識別します.パラメータ最適化,ストップ損失設定などのさらなる改良により,この戦略は,収益の安定性のある量化取引戦略の1つになる可能性があります.
その核心的な優位性は,指標とフィルター条件の有効な組み合わせで,購入タイミングの判断をより正確にすることができるということです.リスクと最適化の方向も制御可能で解決可能です.全体として,これは実用的な高効率の量化戦略です.
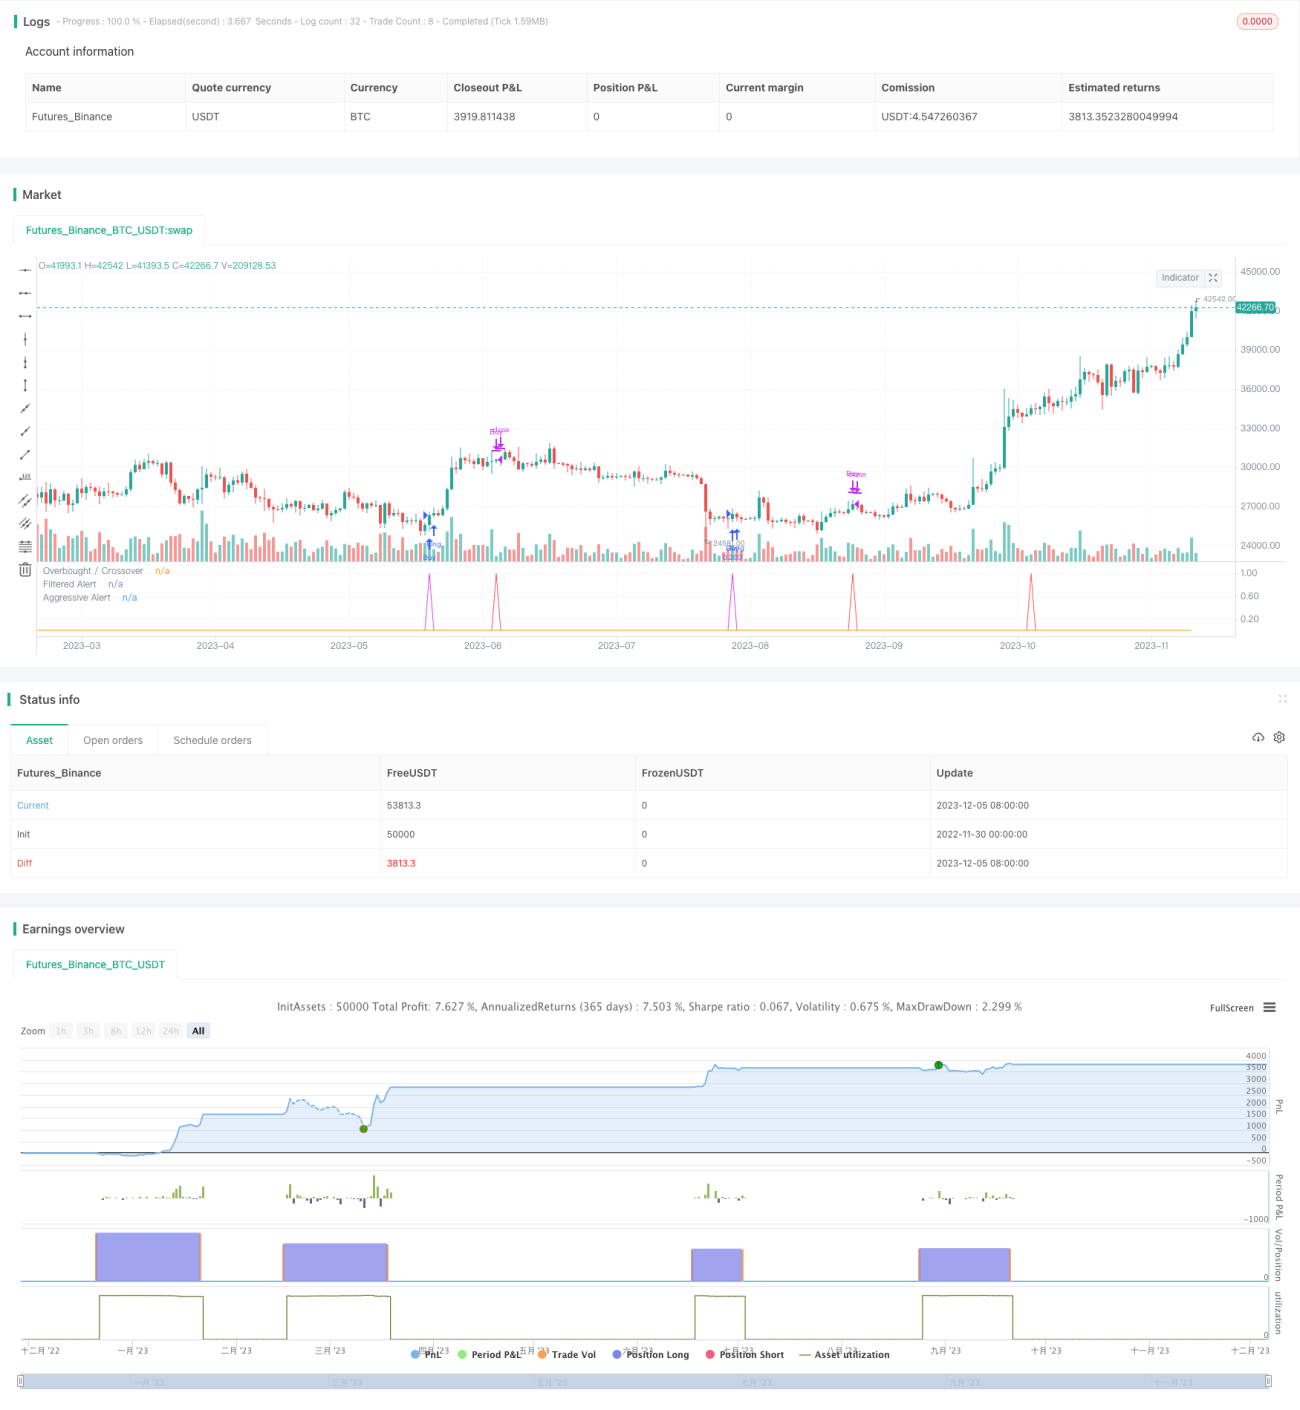
/*backtest
start: 2022-11-30 00:00:00
end: 2023-12-06 00:00:00
period: 1d
basePeriod: 1h
exchanges: [{"eid":"Futures_Binance","currency":"BTC_USDT"}]
*/
//@version=4
strategy("SORAN Buy and Close Buy", pyramiding=1, initial_capital=10000, default_qty_type=strategy.percent_of_equity, default_qty_value=10, overlay=false)
////Buy and Close-Buy messages
Long_message = input("")
Close_message = input("")
///////////// Stochastic Slow
Stochlength = input(14, minval=1, title="lookback length of Stochastic")
StochOverBought = input(80, title="Stochastic overbought condition")
StochOverSold = input(20, title="Stochastic oversold condition")
smoothK = input(3, title="smoothing of Stochastic %K ")
smoothD = input(3, title="moving average of Stochastic %K")
k = sma(stoch(close, high, low, Stochlength), smoothK)
d = sma(k, smoothD)
///////////// RSI
RSIlength = input( 14, minval=1 , title="lookback length of RSI")
RSIOverBought = input( 70 , title="RSI overbought condition")
RSIOverSold = input( 30 , title="RSI oversold condition")
RSIprice = close
vrsi = rsi(RSIprice, RSIlength)
///////////// Double strategy: RSI strategy + Stochastic strategy
pd = input(22, title="LookBack Period Standard Deviation High")
bbl = input(20, title="Bolinger Band Length")
mult = input(2.0 , minval=1, maxval=5, title="Bollinger Band Standard Devaition Up")
lb = input(50 , title="Look Back Period Percentile High")
ph = input(.85, title="Highest Percentile - 0.90=90%, 0.95=95%, 0.99=99%")
new = input(false, title="-------Text Plots Below Use Original Criteria-------" )
sbc = input(false, title="Show Text Plot if WVF WAS True and IS Now False")
sbcc = input(false, title="Show Text Plot if WVF IS True")
new2 = input(false, title="-------Text Plots Below Use FILTERED Criteria-------" )
sbcFilt = input(true, title="Show Text Plot For Filtered Entry")
sbcAggr = input(true, title="Show Text Plot For AGGRESSIVE Filtered Entry")
ltLB = input(40, minval=20, maxval=99, title="Long-Term Look Back Current Bar Has To Close Below This Value OR Medium Term--Default=40")
mtLB = input(14, minval=1, maxval=40, title="Medium-Term Look Back Current Bar Has To Close Below This Value OR Long Term--Default=14")
str = input(3, minval=1, maxval=9, title="Entry Price Action Strength--Close > X Bars Back---Default=3")
//Alerts Instructions and Options Below...Inputs Tab
new4 = input(false, title="-------------------------Turn On/Off ALERTS Below---------------------" )
new5 = input(false, title="----To Activate Alerts You HAVE To Check The Boxes Below For Any Alert Criteria You Want----")
sa1 = input(false, title="Show Alert WVF = True?")
sa2 = input(false, title="Show Alert WVF Was True Now False?")
sa3 = input(false, title="Show Alert WVF Filtered?")
sa4 = input(false, title="Show Alert WVF AGGRESSIVE Filter?")
//Williams Vix Fix Formula
wvf = ((highest(close, pd)-low)/(highest(close, pd)))*100
sDev = mult * stdev(wvf, bbl)
midLine = sma(wvf, bbl)
lowerBand = midLine - sDev
upperBand = midLine + sDev
rangeHigh = (highest(wvf, lb)) * ph
//Filtered Bar Criteria
upRange = low > low[1] and close > high[1]
upRange_Aggr = close > close[1] and close > open[1]
//Filtered Criteria
filtered = ((wvf[1] >= upperBand[1] or wvf[1] >= rangeHigh[1]) and (wvf < upperBand and wvf < rangeHigh))
filtered_Aggr = (wvf[1] >= upperBand[1] or wvf[1] >= rangeHigh[1]) and not (wvf < upperBand and wvf < rangeHigh)
//Alerts Criteria
alert1 = wvf >= upperBand or wvf >= rangeHigh ? 1 : 0
alert2 = (wvf[1] >= upperBand[1] or wvf[1] >= rangeHigh[1]) and (wvf < upperBand and wvf < rangeHigh) ? 1 : 0
alert3 = upRange and close > close[str] and (close < close[ltLB] or close < close[mtLB]) and filtered ? 1 : 0
alert4 = upRange_Aggr and close > close[str] and (close < close[ltLB] or close < close[mtLB]) and filtered_Aggr ? 1 : 0
//Coloring Criteria of Williams Vix Fix
col = wvf >= upperBand or wvf >= rangeHigh ? #00E676 : #787B86
isOverBought = (crossover(k,d) and k > StochOverBought) ? 1 : 0
isOverBoughtv2 = k > StochOverBought ? 1 : 0
filteredAlert = alert3 ? 1 : 0
aggressiveAlert = alert4 ? 1 : 0
plot(isOverBought, "Overbought / Crossover", style=plot.style_line, color=#FF5252)
plot(filteredAlert, "Filtered Alert", style=plot.style_line, color=#E040FB)
plot(aggressiveAlert, "Aggressive Alert", style=plot.style_line, color=#FF9800)
if (filteredAlert or aggressiveAlert)
strategy.entry("Buy", strategy.long, alert_message = Long_message)
if (filteredAlert or aggressiveAlert)
alert("Buy Signal", alert.freq_once_per_bar)
if (isOverBought)
strategy.close("Buy", alert_message = Close_message)