価格チャネルの突破口に基づくドンチャンの定量取引戦略

1
Follow
1779
Followers
概要
この戦略の核心構想は,唐<unk>通路の価格突破状況に基づいて取引を行うことであり,トレンド追跡型の量化戦略である.これは,価格通路を自動的に識別し,価格が通路の突破に沿ってポジションを開くことができ,価格が通路の下沿いの近くまたは止損点に戻ると平仓する.この戦略は,中長線の価格トレンドを捕捉することを目的としており,株式指数などの金融デリバティブのアルゴリズム取引に適用される.
原則
この戦略は,唐<unk>通道指数に基づいており,唐<unk>通道は,与えられた周期内の最高価格と最低価格で描かれた通道領域である.その計算方法は:
軌道上 = 近 n サイクル間の最高値
下線 = 近 n 周期間の最低値
価格が上線を突破すると多頭トレンドに入ると考えられ,価格が下線を突破すると空頭トレンドに入ると考えられる。この戦略は上線を突破した場合にのみ考慮される。
取引の論理は以下の通りです.
- 唐<unk>通路の軌道上をn周期最高値で描画する
- 市場が急激に上昇すると,追加入場をする
- ストップオフは,通路下線近くまたは設定されたストップポイントに閉店価格を戻す
利点
この戦略の利点は以下の通りです.
- 戦略は明確で,理解し,実行しやすい.
- 唐<unk>通路の指標は成熟し,信頼性があり,トレンドの方向を容易に判断できます.
- 自動で通路を識別し,人工で判断する必要はありません.
- 設定可能なパラメータ,適応力
- ストップ・メカニズムで,損失を制限します.
リスク
この戦略にはいくつかのリスクがあります.
- 唐津通路の破片が原因で不必要な損失が発生する可能性がある
- ストップ・ポジションの設定が不適切である場合,損失を拡大する可能性があります.
- <unk>路に近付く際には,反転リスクに注意する必要があります.
- パラメータ設定 (周期長など) が不適切で,戦略の効果に影響する
対応方法:
- 他の指標と組み合わせたフィルタリング平準化偽破裂
- 停止位置を最適化し,滑らかな退出
- 経路の近くで取引量を増やすか,停止範囲を拡大することを検討する
- 異なるパラメータをテストし,最適なパラメータを見つけます.
最適化の方向
この戦略は,以下の点で最適化できます.
- MACD,KDなどの他の指標の判断を追加し,平準破綻を避ける
- 価格変動による移動式止損などの最適化止損機構
- 変動が大きくなる時にのみ取引するなど,最適化された参加制御
- パラメータ最適化,最適なパラメータの組み合わせを探す
要約する
この戦略の全体的な考え方は明確で,理解しやすく,実行しやすく,成熟した唐津通道指標を利用してトレンドの方向を自動的に識別する.同時に,配置は柔軟で,実際の需要に応じて調整することができる.止損とパラメータの最適化により,よりよい効果を得ることができる.全体的に,この戦略は,操作が容易で,一定の効率性を持ち,量化取引の入門戦略の一つとして適している.
Source
Pine
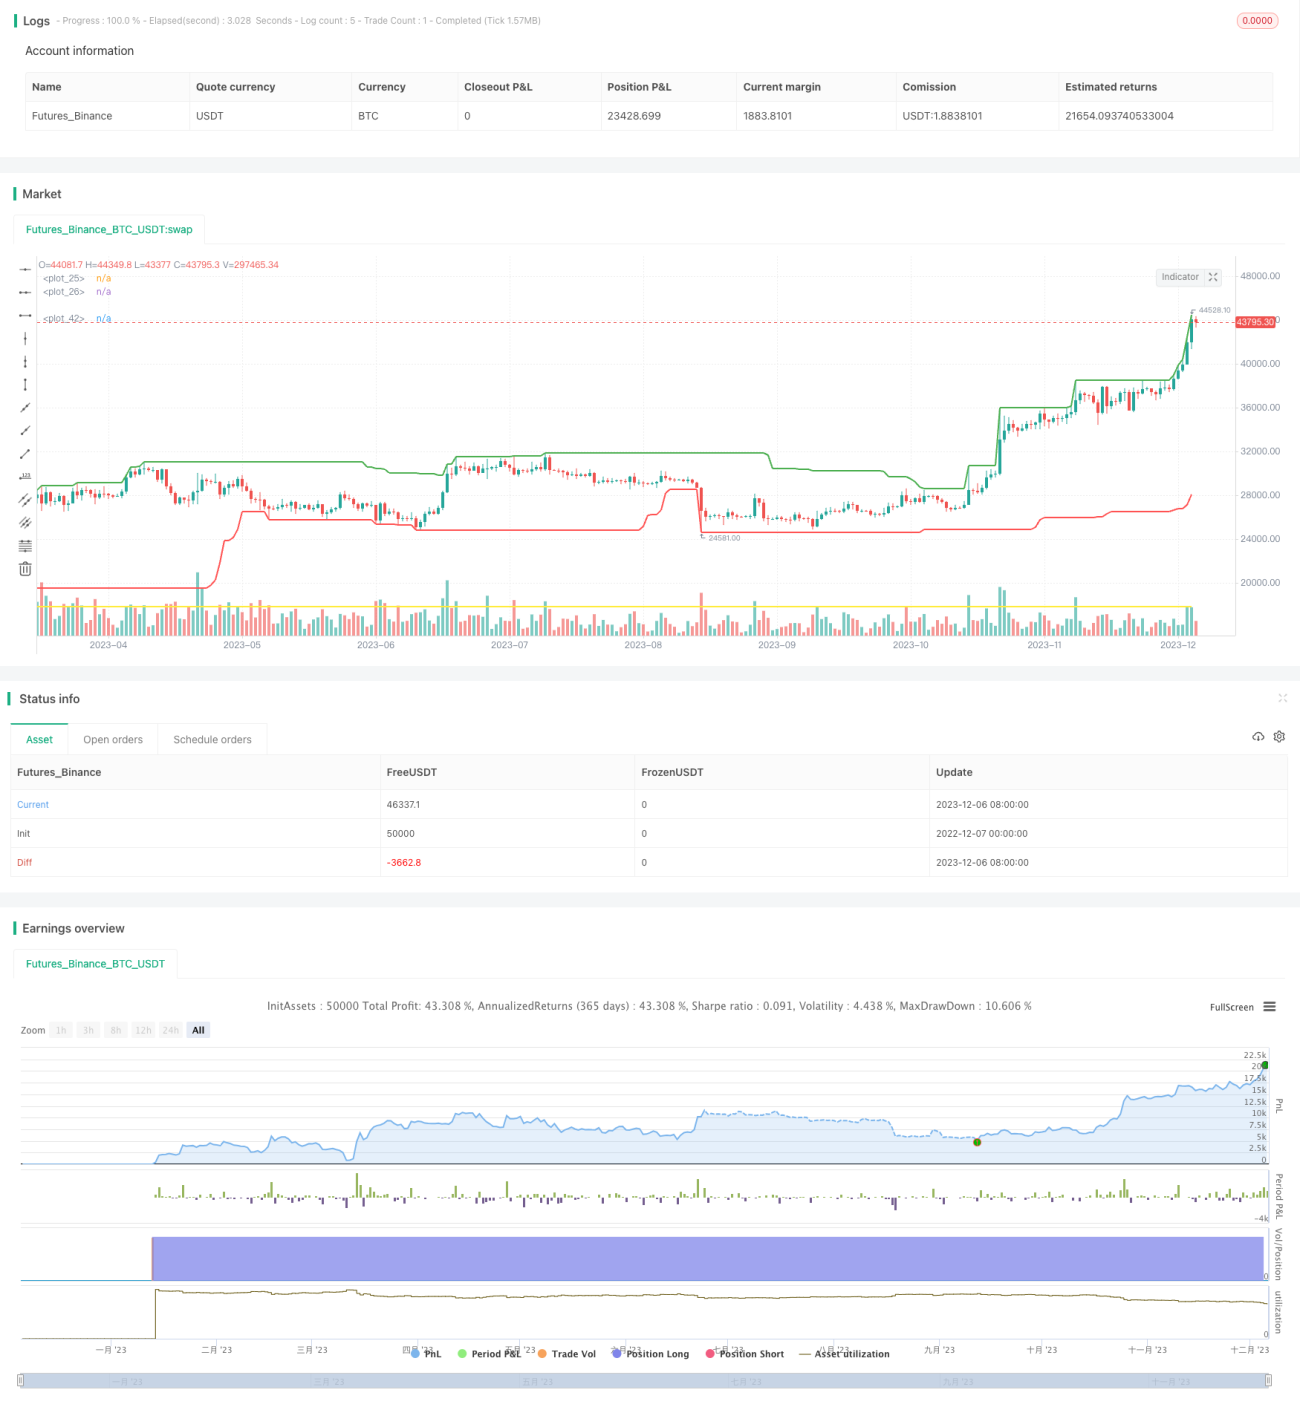
/*backtest
start: 2022-12-07 00:00:00
end: 2023-12-07 00:00:00
period: 1d
basePeriod: 1h
exchanges: [{"eid":"Futures_Binance","currency":"BTC_USDT"}]
*/

// This source code is subject to the terms of the Mozilla Public License 2.0 at https://mozilla.org/MPL/2.0/
// © Giovanni_Trombetta

// Strategy to capture price channel breakoutsStrategy parameters
Related strategies
Comment
All comments (0)
No data
- 1