移動平均線突破ボリンジャーバンド戦略

1
Follow
1779
Followers
概要
この戦略は,移動平均指数,ブリン帯指数,UT Bot Alerts指数と組み合わせて,簡単な突破操作戦略を実現する.価格がブリン帯を突破して軌道に乗ったとき,多めに行い,価格がブリン帯を突破して軌道を下ったとき,空いて行きます.
戦略原則
- 200周期のEMAをトレンドの判断として使用する中枢軸.価格がEMA上では看板であり,価格がEMA下では下落である.
- UT Bot Alertsの指標はATRと結合し,買入シグナルを生成する.価格と高速EMAの交差ブリンが軌道に乗ったときに多信号を生成する.価格と高速EMAの交差ブリンが軌道に乗ったときに空信号を生成する.
- ATR止損指標は止損点を設定するために使用される.止損距離はATR値の1.5倍である.
- 入場後,リスク・リターン比を設定し,ストップ・ストップ・ストップとストップ・ロスを入場価格に移動する.
優位分析
- ブリン帯の指標を使って,多空のタイミングを判断することで,利益の確率を高めることができます.
- UT Bot Alertsの指標は,より正確な信号を生成する.
- リスク・報酬比を用いたストップ・ストップは,リスクを効果的にコントロールできる.
リスク分析
- ブリン帯は,震動の都市で誤信号を発生させる.
- ATRは遅滞性があり,トレンドの初期段階ではストップダメージ距離が大きすぎる可能性があります.
- リスク・リターン・比率の不適切な設定は 極端に極端に保守的になる可能性があります.
最適化の方向
- UT Bot Alertsの代わりに他の指標を試してみてください.
- ATRの周期と倍数を最適化して,止損距離を適当にすることができる.
- 異なるリスク/リターン比率をテストして最適なパラメータを見つけることができます.
要約する
この戦略は,複数の指標の優位性を統合し,強力な実用性を有する.パラメータを最適化することで,安定した信頼性の高い突破システムになることができる.しかし,指標の失敗やパラメータの不適切性によるリスクの予防にも注意が必要である.
Source
Pine
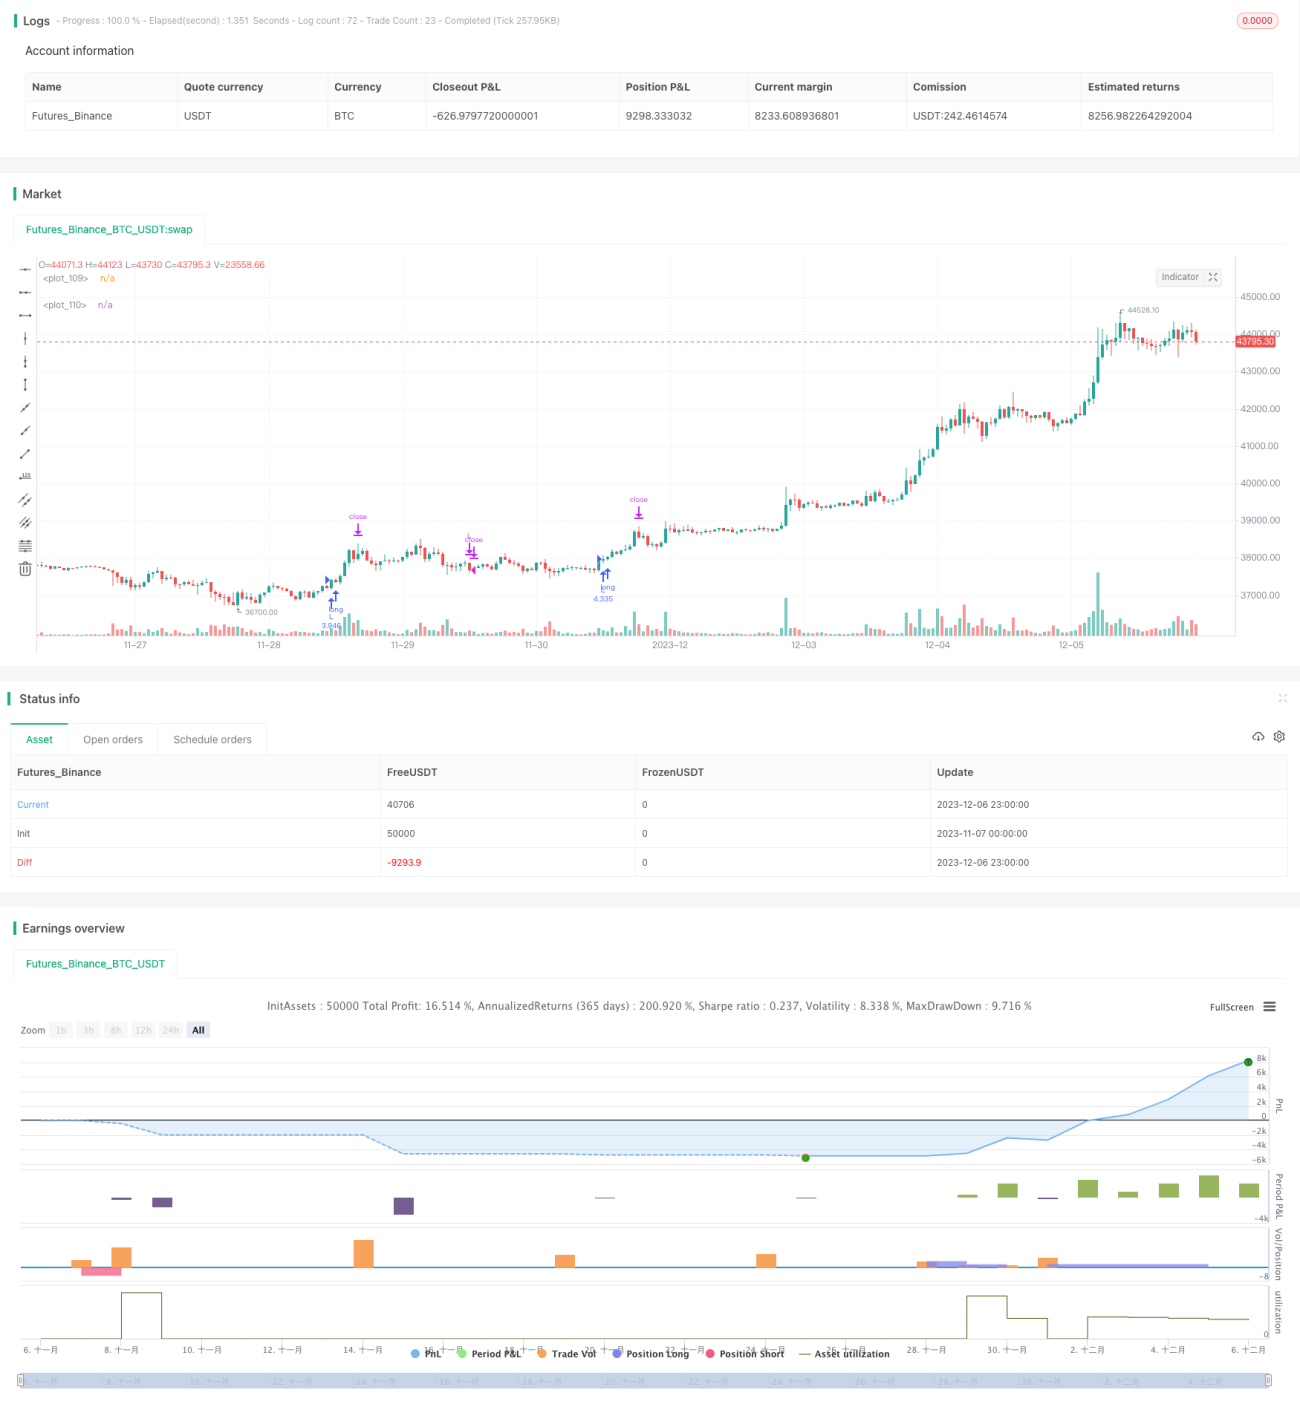
/*backtest
start: 2023-11-07 00:00:00
end: 2023-12-07 00:00:00
period: 1h
basePeriod: 15m
exchanges: [{"eid":"Futures_Binance","currency":"BTC_USDT"}]
*/

// This source code is subject to the terms of the Mozilla Public License 2.0 at https://mozilla.org/MPL/2.0/
//@version=5
//Developed by StrategiesForEveryone
Strategy parameters
Related strategies
Comment
All comments (0)
No data
- 1