移動平均ゴールデンクロスとデッドクロストレンド追跡戦略

1
Follow
1779
Followers
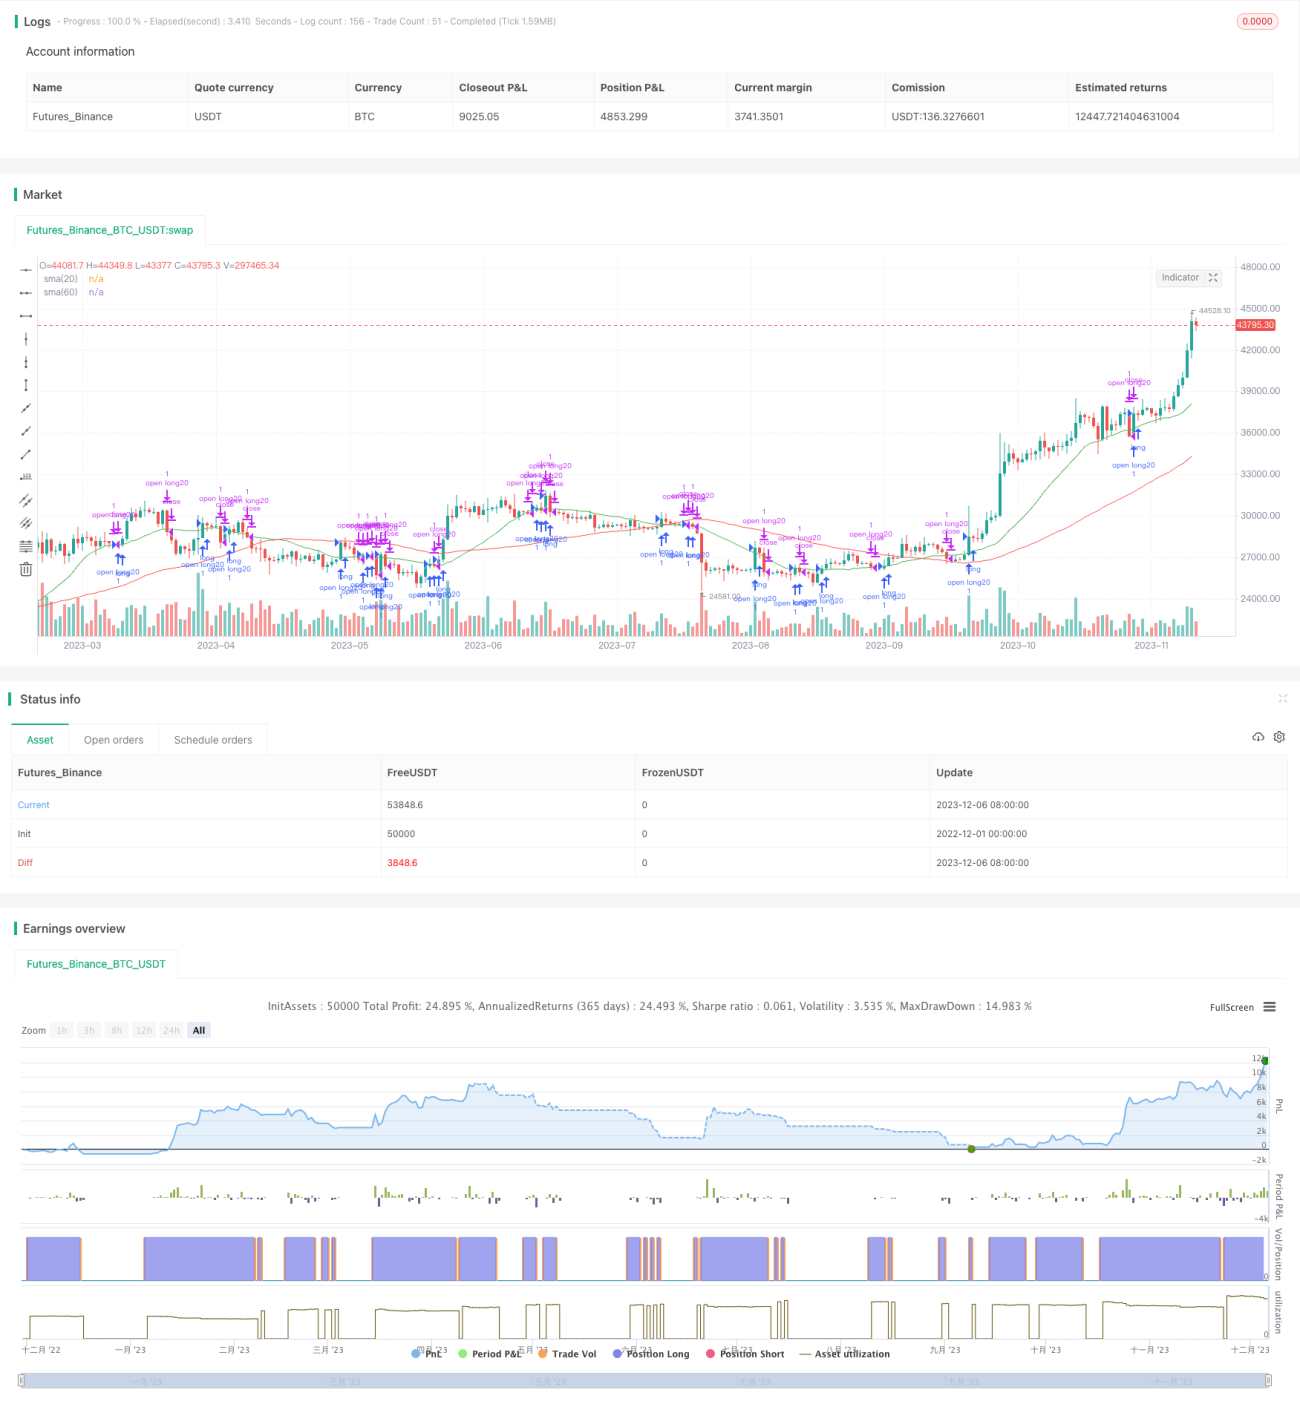
この戦略は,20日線と60日線の移動平均を交差して買入シグナルを形成する.価格が上昇して20日線を突破すると,多めにする.価格が下がって20日線を突破すると,平仓する.同様に,価格が60日線を突破すると,買入シグナルを形成する.この戦略は典型的なトレンドフォロー戦略である.
戦略原則
- 20日間の移動平均と60日間の移動平均を計算します.
- 取引終了時に20日線を越えたら,もっとやる
- 閉盤価格が20日線を突破すると平仓
- 市場が60日線を超えると,もっと稼ぎなさい.
- 閉盤価格が60日線を突破すると平仓
上記は,この戦略を構成する取引のシグナルとルールである. 価格が平均を突破すると,トレンドが始まることを示すので,トレンドをさらに追跡することができます. 価格が平均を下回ると,トレンドが終わることを示すので,平仓は正しい選択です.
戦略的優位性
- 二重移動平均の組み合わせにより,戦略がより安定する.20日線は,短期トレンドの機会をより迅速に捉えることができる.60日線は,短期市場のノイズの一部をフィルターして,中長期のトレンドをロックします.
- 戦略反省 2018年から台湾の株式市場を選び,大陸A株,台株の取引制度はより完備で,戦略効果を反映している.
- 合理的なストップとポジションコントロールを設定し,リスクを最大限にコントロールする.
戦略リスク
- 戦略は,移動平均指標のみに基づいているので,市場には明らかな傾向がないときに,より多くのWhirlawayと差が生まれます.
- 戦略は,購入/販売の量とポジションを最適化していないため,資金の最大化ができない.
- この戦略は,価格の上昇と低下に対称的に反応し,市場の変化に対応できない.
リスク対策:
- KDJ,MACDなどの他の指標の組み合わせを追加して,複数の検証を形成し,誤った取引を避ける.
- 市場価値,変動率などの要因に基づいてポジションと取引資金の利用効率を最適化できます.
- 大盘指数の異なる段階に応じて非対称操作を適用し,震動調整時に取引を減らす,明確なトレンド時にポジションを拡大することができる.
戦略最適化の方向性
- 買い売りを最適化する. ストップ・ロスの情報動態に応じてポジション数を調整できる.
- 移動平均の天数パラメータを最適化する. ステップアップ最適化,ランダム最適化などの方法により,より優良なパラメータを見つけることができる.
- 移動ストップまたは単一のストップを掛けた場合,利益をより保護できます.
- ポジション管理を増やす. 資金規模,市值規模に応じて単一取引のポジションを動的に調整する.
要約する
この戦略は,全体として典型的な双動平均の交差戦略である.その核心構想は,トレンドを追跡し,価格が平均線を破るときにトレンドの位置を確立することである.戦略は,シンプルで実用的で,容易に実行できる.また,パラメータ最適化,ストップ損失回避,ポジション管理などの手段によって,より良い戦略効果を得るためのいくつかの最適化可能なスペースがある.
Source
Pine
Strategy parameters
Related strategies
Comment
All comments (0)
No data
- 1