
移動平均の反発策は,価格が移動平均の突破を追跡する策である.それはが移動平均の下から反発したかどうかをチェックし,もしそうなら,多頭信号である.もしが移動平均の上から下方方向に反発したならば,空頭信号である.
Exponential Moving Average Bounce Strategy
この戦略は指数関数移動平均に基づいています. EMAラインをリアルタイムで計算します. そして,価格がEMAラインの上または下から反発しているかどうかをチェックします.
この反撃は,戦略の入場信号である.
EMAの反発策は,価格の反転が確認された後にのみ入場し,逆転操作を防ぐことができる.
指数移動平均を使用しているため,価格データを効率的に平らにし,市場騒音をフィルターすることで,戦略の引き下がりが小さく,歴史的な利益がより良くなります.
EMA反転策略は,移動平均のみに依存し,非常に単純で直接で,初心者にとっては容易に理解できます.同時に,EMA周期パラメータは,異なる品種に合わせて柔軟に調整できます.
EMAラインの近くにはしばしば密集した偽突破があり,誤信号を引き起こす可能性がある.これらのノイズをフィルターするためにEMAパラメータを調整する必要がある.
この戦略は本質的に順位操作である。価格の転換点を予測できず,トレンドを追うのみである。これは周期的な調整を逃すのに最適な入場時間である。
移動平均線の近くのストップレベルは,時として破られ,損失が拡大する.これは,より柔軟なストップ方法の適用を必要とする.
RSI,MACDなどの他の指標を添加して,価格の逆転を確認し,偽の信号をフィルターすることができます.
タイムストップ,ショッキングストップなどのより柔軟なストップ方式が使用され,撃墜されるリスクを低減することができる.
EMA周期パラメータを最適化して最適なパラメータの組み合わせを見つけます.また,EMAパラメータを動的に変更して,市場周期を追跡することができます.
移動平均反転戦略は,シンプルで実用的なトレンド追跡戦略である.それは順調に動作し,後退は小さく,容易に理解できる.また,ある程度の偽信号リスクとストップのリスクもある.我々は,より良い指標の組み合わせ,ストップの方法,パラメータの選択によって,この戦略を最適化して,安定した信頼性の高い量化戦略にすることができる.
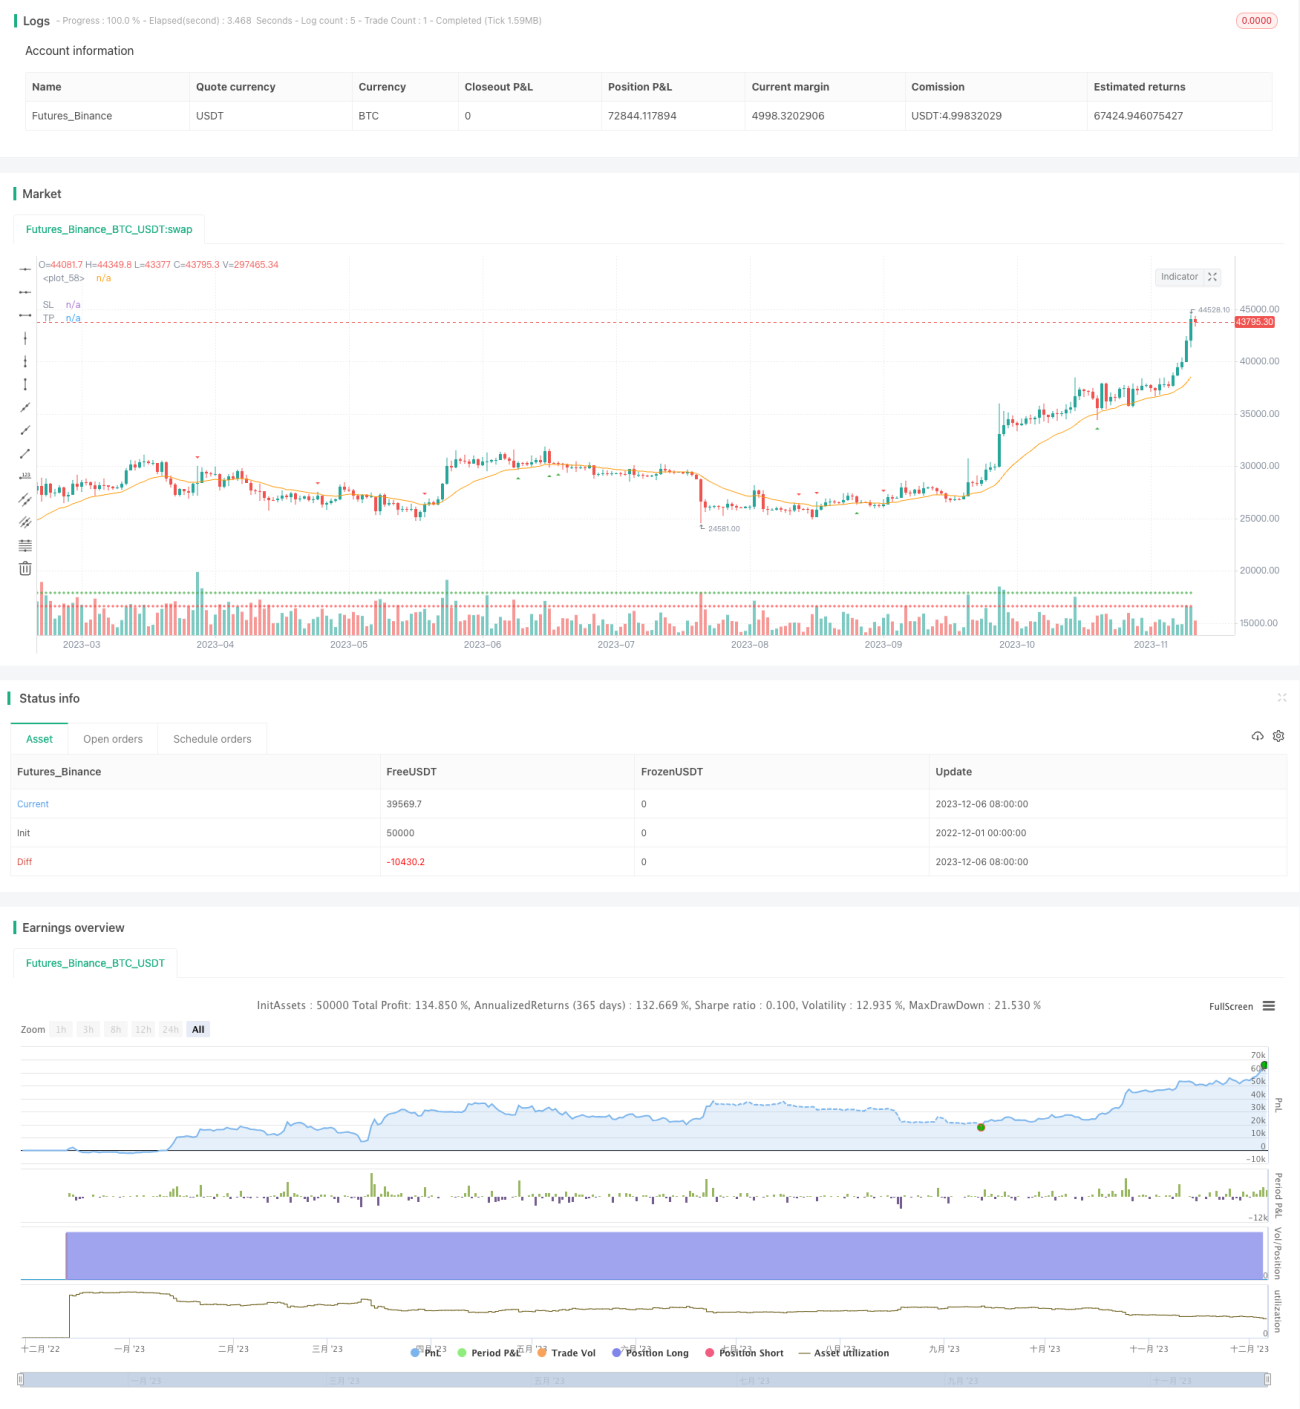
/*backtest
start: 2022-12-01 00:00:00
end: 2023-12-07 00:00:00
period: 1d
basePeriod: 1h
exchanges: [{"eid":"Futures_Binance","currency":"BTC_USDT"}]
*/
// This source code is subject to the terms of the Mozilla Public License 2.0 at https://mozilla.org/MPL/2.0/
// © tweakerID
// Simple strategy that checks for price bounces over an Exponential Moving Average. If the CLOSE of the candle bounces
// back from having it's LOW below the EMA, then it's a Bull Bounce. If the CLOSE of the candle bounces down from having it's
// high above the EMA, then it's a Bear Bounce. This logic can be reverted.
//@version=4
strategy("EMA Bounce", overlay=true,
default_qty_type=strategy.percent_of_equity,
default_qty_value=100,
initial_capital=10000,
commission_value=0.04,
calc_on_every_tick=false,
slippage=0)
direction = input(0, title = "Strategy Direction", type=input.integer, minval=-1, maxval=1)
strategy.risk.allow_entry_in(direction == 0 ? strategy.direction.all : (direction < 0 ? strategy.direction.short : strategy.direction.long))
/////////////////////// STRATEGY INPUTS ////////////////////////////////////////
title1=input(true, "-----------------Strategy Inputs-------------------")
i_EMA=input(20, title="EMA Length")
/////////////////////// BACKTESTER /////////////////////////////////////////////
title2=input(true, "-----------------General Inputs-------------------")
// Backtester General Inputs
i_SL=input(true, title="Use Swing Stop Loss and Take Profit")
i_SPL=input(defval=10, title="Swing Point Loopback")
i_PercIncrement=input(defval=.2, step=.1, title="Swing Point SL Perc Increment")*0.01
i_TPRRR = input(1.2, step=.1, title="Take Profit Risk Reward Ratio")
// Bought and Sold Boolean Signal
bought = strategy.position_size > strategy.position_size[1]
or strategy.position_size < strategy.position_size[1]
// Price Action Stop and Take Profit
LL=(lowest(i_SPL))*(1-i_PercIncrement)
HH=(highest(i_SPL))*(1+i_PercIncrement)
LL_price = valuewhen(bought, LL, 0)
HH_price = valuewhen(bought, HH, 0)
entry_LL_price = strategy.position_size > 0 ? LL_price : na
entry_HH_price = strategy.position_size < 0 ? HH_price : na
tp=strategy.position_avg_price + (strategy.position_avg_price - entry_LL_price)*i_TPRRR
stp=strategy.position_avg_price - (entry_HH_price - strategy.position_avg_price)*i_TPRRR
/////////////////////// STRATEGY LOGIC /////////////////////////////////////////
EMA=ema(close, i_EMA)
LowAboveEMA=low > EMA
LowBelowEMA=low < EMA
HighAboveEMA=high > EMA
HighBelowEMA=high < EMA
BullBounce=LowAboveEMA[1] and LowBelowEMA and close > EMA //and close > open
BearBounce=HighBelowEMA[1] and HighAboveEMA and close < EMA //and close < open
plot(EMA)
BUY=BullBounce
SELL=BearBounce
//Inputs
DPR=input(false, "Allow Direct Position Reverse")
reverse=input(false, "Reverse Trades")
// Entries
if reverse
if not DPR
strategy.entry("long", strategy.long, when=SELL and strategy.position_size == 0)
strategy.entry("short", strategy.short, when=BUY and strategy.position_size == 0)
else
strategy.entry("long", strategy.long, when=SELL)
strategy.entry("short", strategy.short, when=BUY)
else
if not DPR
strategy.entry("long", strategy.long, when=BUY and strategy.position_size == 0)
strategy.entry("short", strategy.short, when=SELL and strategy.position_size == 0)
else
strategy.entry("long", strategy.long, when=BUY)
strategy.entry("short", strategy.short, when=SELL)
SL=entry_LL_price
SSL=entry_HH_price
TP=tp
STP=stp
strategy.exit("TP & SL", "long", limit=TP, stop=SL, when=i_SL)
strategy.exit("TP & SL", "short", limit=STP, stop=SSL, when=i_SL)
/////////////////////// PLOTS //////////////////////////////////////////////////
plot(strategy.position_size > 0 ? SL : na , title='SL', style=plot.style_cross, color=color.red)
plot(strategy.position_size < 0 ? SSL : na , title='SSL', style=plot.style_cross, color=color.red)
plot(strategy.position_size > 0 ? TP : na, title='TP', style=plot.style_cross, color=color.green)
plot(strategy.position_size < 0 ? STP : na, title='STP', style=plot.style_cross, color=color.green)
// Draw price action setup arrows
plotshape(BUY ? 1 : na, style=shape.triangleup, location=location.belowbar,
color=color.green, title="Bullish Setup", transp=80, size=size.auto)
plotshape(SELL ? 1 : na, style=shape.triangledown, location=location.abovebar,
color=color.red, title="Bearish Setup", transp=80, size=size.auto)