移動平均トレンドフォロー取引戦略


作成日: 2023-12-11 15:05:31 最終変更日: 2023-12-11 15:05:31
コピー: 0 クリック数: 576
1
フォロー
1621
フォロワー

移動平均トレンドフォロー取引戦略

概要

この戦略は,移動平均と価格変動率を計算し,一定の周期内のK線と組み合わせて,現在上昇傾向にあるか下落傾向にあるかを判断し,それに応じて多額の取引または空調を行う.

戦略原則

この策略は,まず,長さ l の単純な移動平均 a と長さ l の価格変化率 r を計算する.それから,現在の K 線価格と移動平均の差値 k を計算する.最後に,過去 s 根 K 線の合計sum k を計算する.

sum>0の場合,現在上昇傾向にあることを示すので,この戦略は多めにします.sumの場合,現在下落傾向にあることを示すので,この戦略は空っぽになります.

余分な空白をした後,トレンドが逆転するまではポジションを保持します (sumは正から負へ,または負から正へ),その時は平仓になります.

優位分析

この戦略の最大の利点は,トレンドを捉え,トレンド取引に適していることです.具体的には,以下の利点があります.

  1. 移動平均を用いて,全体的なトレンドの方向性を判断し,市場騒音を効果的にフィルターし,主要トレンドをロックすることができます.

  2. 価格変動率指数で動力の強さを測定し,強を逃さないようにする.

  3. 一定の周期で複数のK線を考慮すると,傾向をより正確に判断し, einzelne Ausreißer in die Irre führenを避けることができる.

  4. トレンドが変化しない限り,ポジションを維持し,トレンドの利潤を最大限に享受してください.

リスク分析

この戦略には以下のリスクがあります.

  1. トレンドの終了時刻を正確に判断できず,早めにストップダストをしたり,利益の一部を逃したりする可能性があります.

  2. 単一の損失の大きさを効果的に制御できない,極端な状況では損失が大きい可能性があります.

  3. 戦略のパラメータを間違えた場合,取引が頻発し,取引の機会を逃す可能性があります.

  4. 長期にわたって持っていれば,夜間利息や保証金のリスクがあります.

リスク管理のために,ストップ・ロスを設定し,高流動性の商品のみを取引し,最適化パラメータおよび合理的なレバレッジの使用を行うことができます.

最適化の方向

この戦略は,以下のような点で最適化できます.

  1. 各長さの移動平均と価格変動率をテストし,最適なパラメータの組み合わせを見つける.

  2. MACDなどの他の指標で判断傾向を試すことで,さらに精度を上げることができます.

  3. ポジション管理機構の追加,例えば,収益後の部分停止など,単発損失の制御.

  4. 波動率指数と組み合わせたダイナミックストップを設定し,極端な状況のリスクを下げます.

  5. ポジション開設とポジションのロジックを最適化し,偽突破をフィルターして取引効率を向上させる.

要約する

この戦略の全体的な構想は明確で,容易に実現し,トレンドを追跡して長線保有取引を行い,撤回制御は比較的合理的で,安定した収益を追求する投資家に適しています.止損とポジション管理などのメカニズムをさらに最適化できれば,より良い長期の安定したリターンを得ることが期待されます.
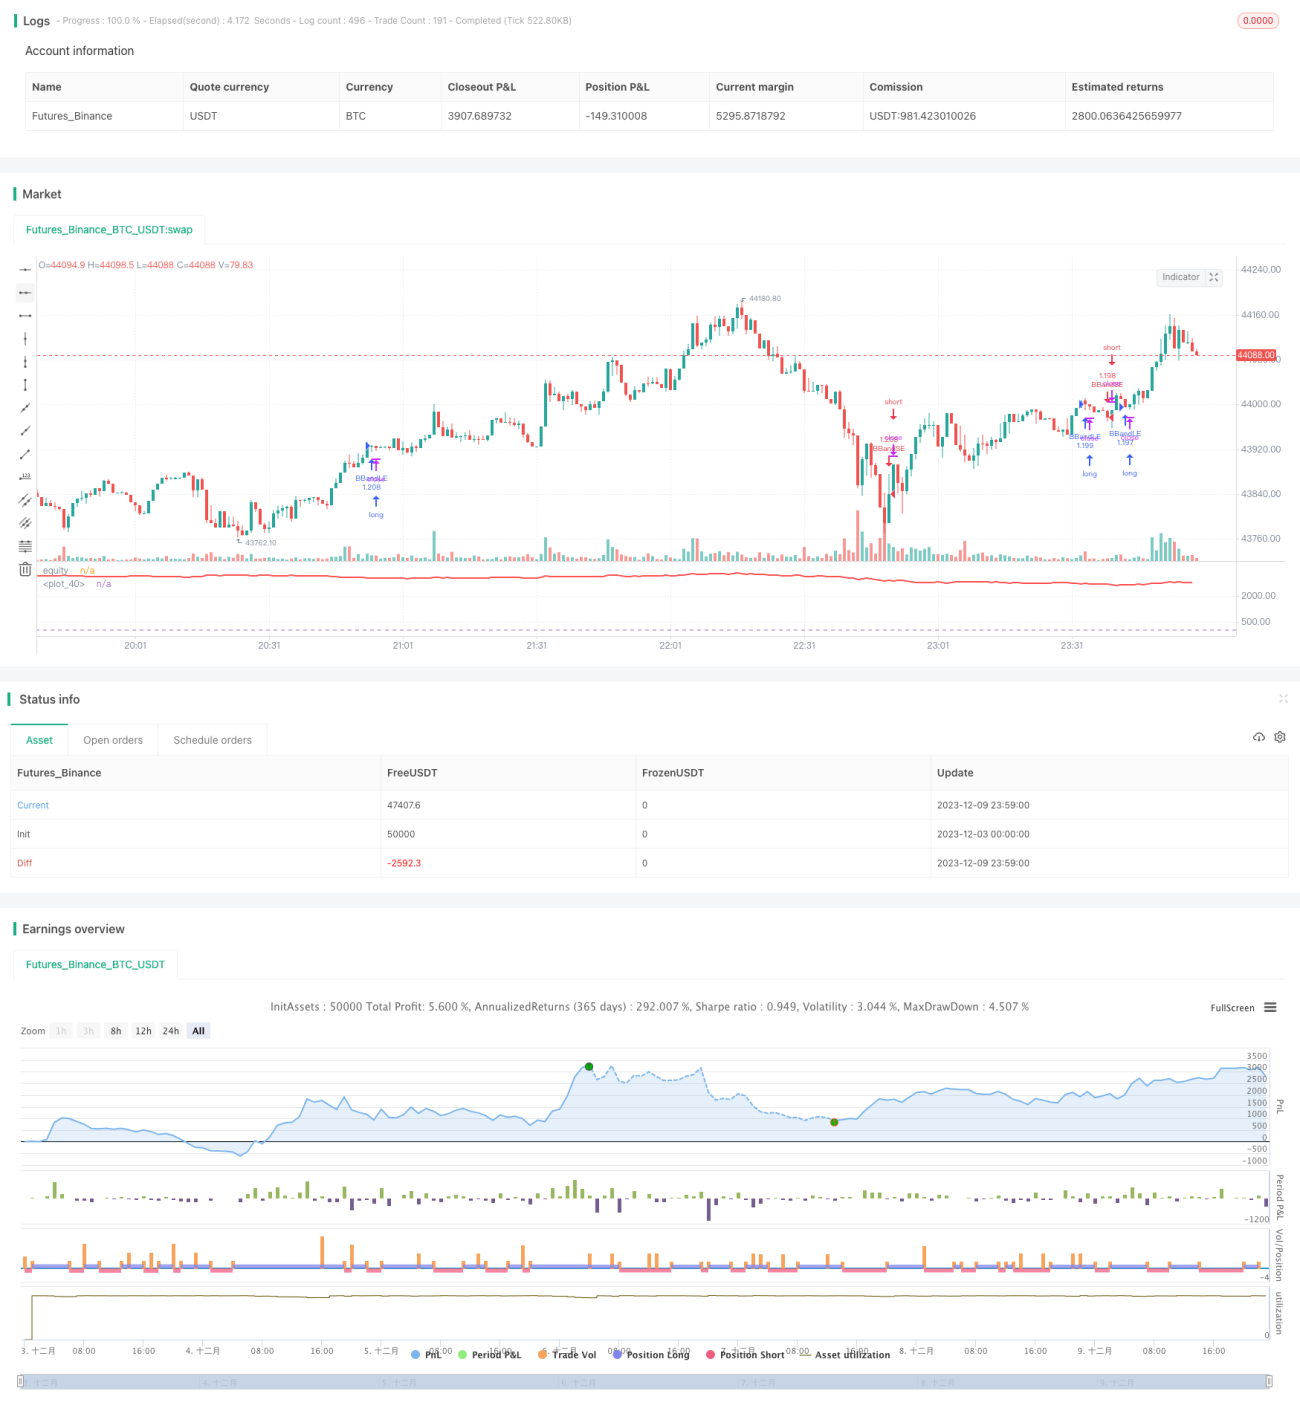
ストラテジーソースコード
/*backtest
start: 2023-12-03 00:00:00
end: 2023-12-10 00:00:00
period: 1m
basePeriod: 1m
exchanges: [{"eid":"Futures_Binance","currency":"BTC_USDT"}]
*/

//@version=2
strategy("Indicator Integrator Strat",default_qty_type = strategy.percent_of_equity, default_qty_value = 100,currency="USD",initial_capital=662, overlay=false)

l = input(defval=170,title="Length for indicator")
s = input(title="Length of summation",defval=18)
a= sma(close,l)
r=roc(close,l)
k=close-a
sum = 0
for i = 0 to s
    sum := sum + k[i]
//plot(a,color=yellow,linewidth=2,transp=0)
//bc =  iff( sum > 0, white, teal)
//plot(sum,color=bc, transp=20, linewidth=3,style=columns)
//plot(sma(sum,3),color=white)
//hline(0)

inpTakeProfit = input(defval = 0, title = "Take Profit", minval = 0)
inpStopLoss = input(defval = 0, title = "Stop Loss", minval = 0)
inpTrailStop = input(defval = 0, title = "Trailing Stop Loss", minval = 0)
inpTrailOffset = input(defval = 0, title = "Trailing Stop Loss Offset", minval = 0)
useTakeProfit = inpTakeProfit >= 1 ? inpTakeProfit : na
useStopLoss = inpStopLoss >= 1 ? inpStopLoss : na
useTrailStop = inpTrailStop >= 1 ? inpTrailStop : na
useTrailOffset = inpTrailOffset >= 1 ? inpTrailOffset : na

////buyEntry = crossover(source, lower)
////sellEntry = crossunder(source, upper)
if sum>0
    strategy.entry("BBandLE", strategy.long, oca_name="BollingerBands",  comment="BBandLE")
else
    strategy.cancel(id="BBandLE")
if sum<0
    strategy.entry("BBandSE", strategy.short, oca_name="BollingerBands",  comment="BBandSE")
else
    strategy.cancel(id="BBandSE")

strategy.initial_capital = 50000
plot(strategy.equity-strategy.initial_capital-strategy.closedtrades*.25/2, title="equity", color=red, linewidth=2)
hline(0)
//longCondition = sum>0
//exitlong = sum<0

//shortCondition = sum<0
//exitshort = sum>0

//strategy.entry(id = "Long", long=true, when = longCondition)
//strategy.close(id = "Long", when = exitlong)
//strategy.exit("Exit Long", from_entry = "Long", profit = useTakeProfit, loss = useStopLoss, trail_points = useTrailStop, trail_offset = useTrailOffset, when=exitlong)

//strategy.entry(id = "Short", long=false, when = shortCondition)
//strategy.close(id = "Short", when = exitshort)
//strategy.exit("Exit Short", from_entry = "Short", profit = useTakeProfit, loss = useStopLoss, trail_points = useTrailStop, trail_offset = useTrailOffset, when=exitshort)