ダブル移動平均ボリンジャーバンドトレンドフォロー戦略

概要
この戦略は,2つの異なる周期の指数移動平均 ((EMA) を計算して市場のトレンド方向を判断し,トレンド方向が決定された前提で,ブリンに自調して超買超売の機会を発見し,トレンドフォロー取引を実現する.
戦略原則
-
200周期と30周期EMAを計算し,200EMAが30EMAより大きい場合は長線傾向の上昇として判断し,そうでない場合は長線傾向の低下として判断する.
-
傾向方向を決定した後,ブリン帯の基線,上線,下線を計算する. 基線は構成周期 (例えば8周期) を用いた SMA,帯幅は同じ周期の最高値と最低値の極差の構成倍数 (例えば1.3と1.1) を用いた SMA).
-
長線上では,価格が上から下へと突破すると買点として判断する.長線下では,価格が上から下へと突破すると売点として判断する.
-
偽突破をフィルタリングするために,突破時に前K線の変動率が設定可能な値 (例えば3%) 未満であるかどうかをチェックし,ブリン帯の上下軌道の間の距離が設定可能な距離要求 (例えば2.2%) よりも大きいかどうかをチェックする.
-
ポジション開設後に設定可能なストップ (例えば3%) とストップ (例えば10%) を設定して,利益をロックする.
戦略的優位性
-
双 EMAは主動傾向を判断し,主動傾向が不明の時に無秩序なポジション開設を避ける.
-
順応ブリン帯の開場点を設定し,トレンドに応じて自動で帯域幅のパラメータを調整し,さらにトレンドをロックする.
-
変速率と最小帯域のチェックメカニズムが偽突破を効果的にフィルターする.
-
ストップ・ストップ・ストップの設定は合理的で,ローキング・リターンのリスクは制御可能である.
戦略リスク
-
双 EMAは,ターニングポイントを正確に判断できず,トレンドのターニングチャンスを逃す可能性があります.
-
ブリン帯のパラメータが正しく設定されていない場合,偽信号が発生する可能性があります.
-
固定ストップ・ストップは市場の波動に適応するのが難しい.
最適化の方向
-
他の指標と組み合わせてトレンドを判断し,主要トレンドの転換点を決定する.
-
ブリン帯のパラメータを動的に調整する方法.
-
条件の単一ストップストップを設定し,特定の条件に応じてストップラインを調整する.
要約する
この戦略は,双EMA判断主トレンドとブリン帯発見の機会の方法を総合的に使用してトレンド追跡取引を実現する.戦略の優位性は,合理的に開場条件と停止条件を設定することで,トレンドの利益を効果的にロックすることができる.同時に,ターニングポイントを判断できず,ブリン帯パラメータを正しく設定しないなどの一定のリスクもある.これらの問題は,さらなる最適化のための余地があり,戦略がトレンドの利益をよりよく把握することができる.
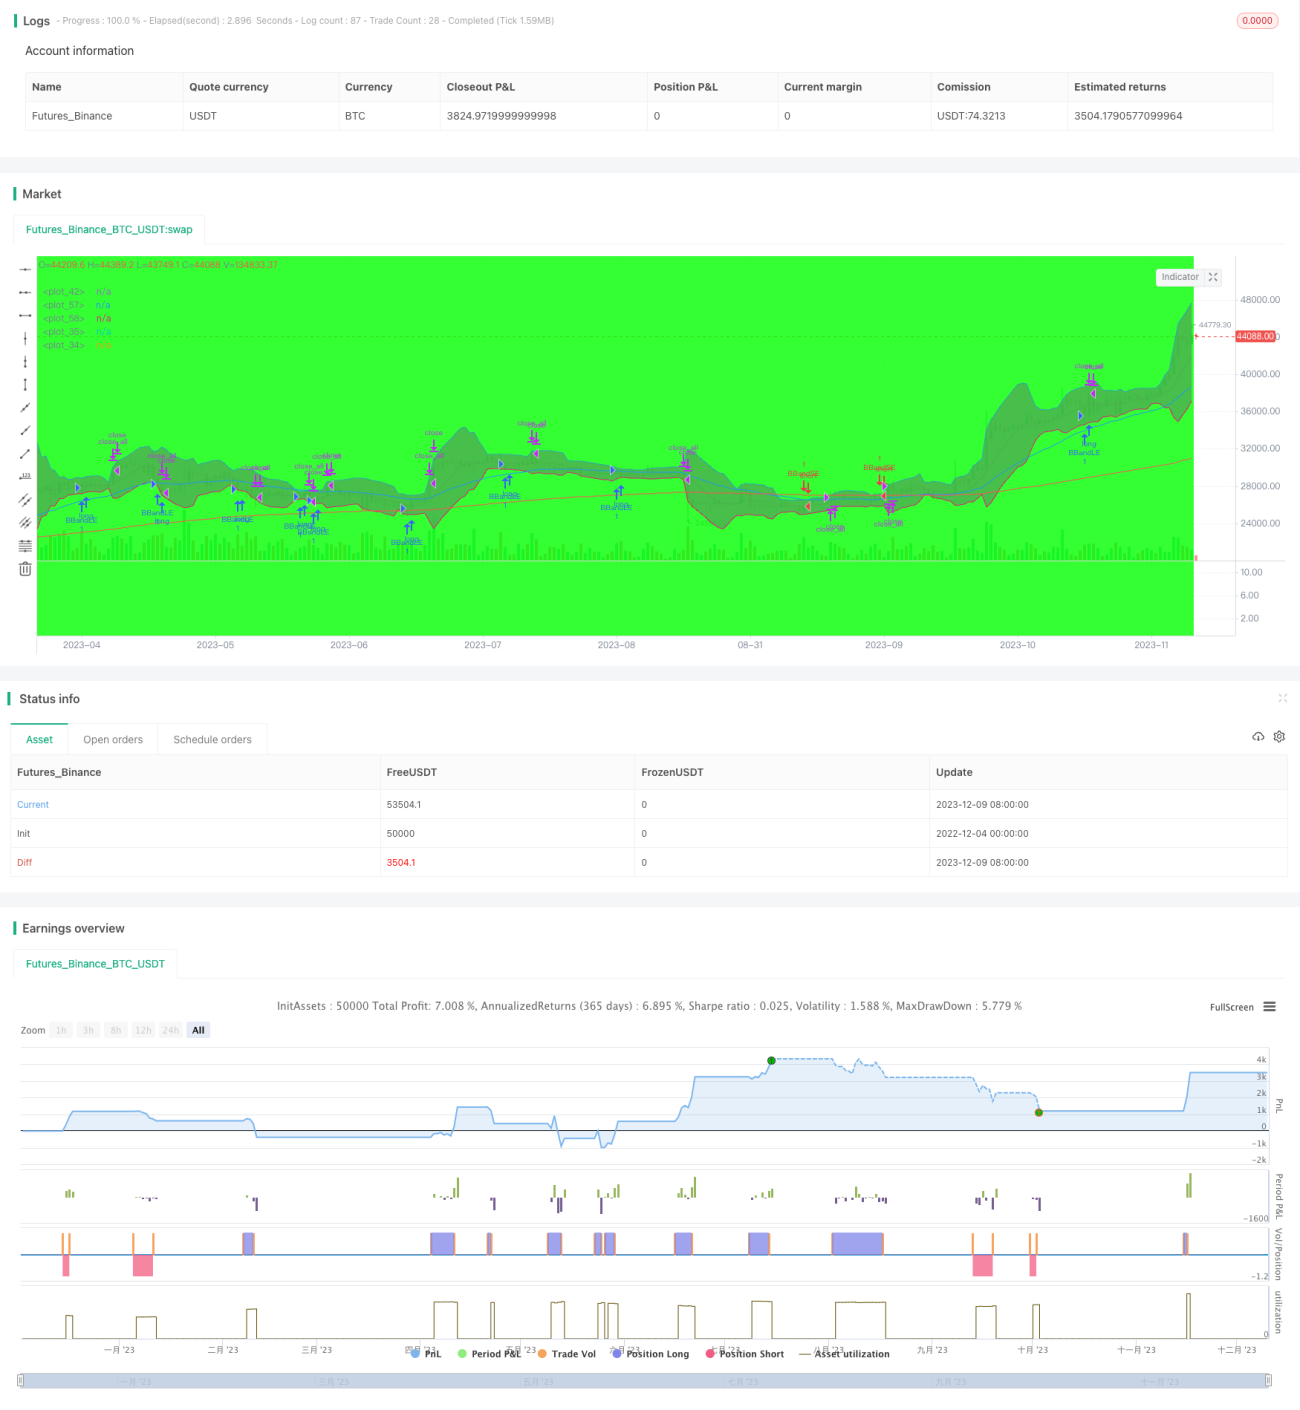
/*backtest
start: 2022-12-04 00:00:00
end: 2023-12-10 00:00:00
period: 1d
basePeriod: 1h
exchanges: [{"eid":"Futures_Binance","currency":"BTC_USDT"}]
*/

//@version=3
//////////////////////////////////////////////////////////////////////
// Component Code Start
testStartYear = input(2019, "Backtest Start Year")- 1