
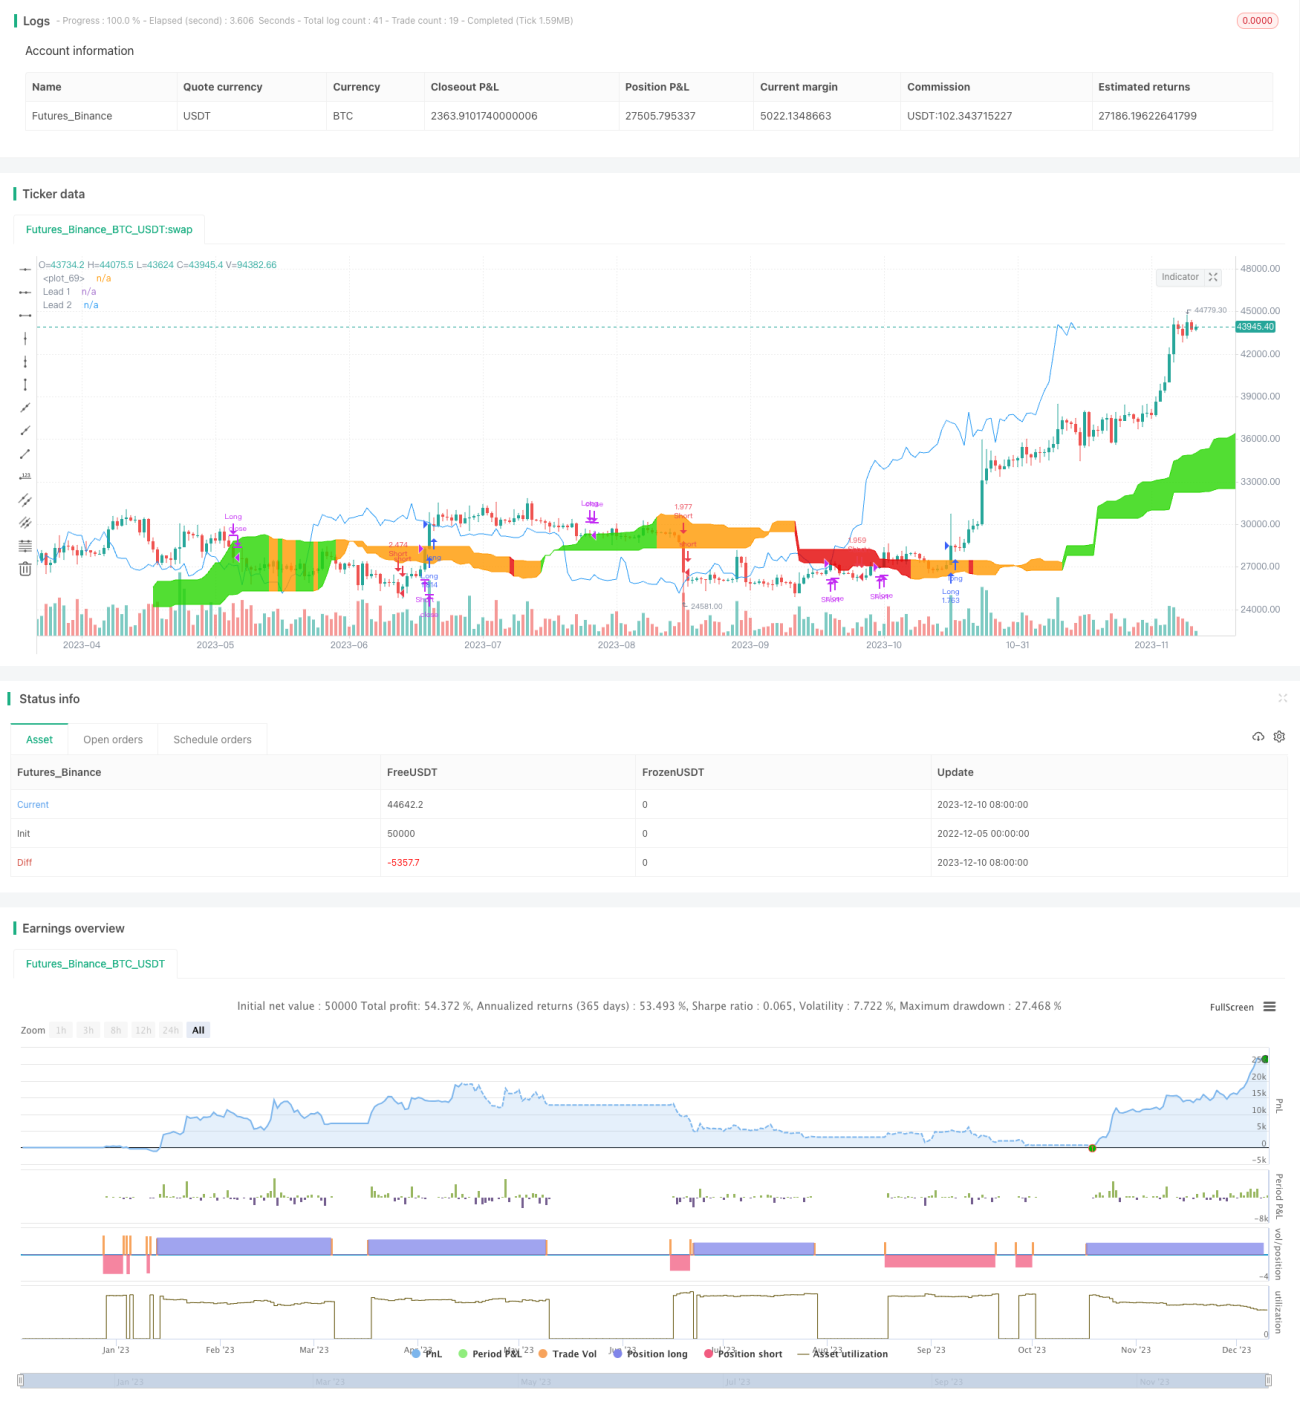
一雲二次予知チャンス均線トレンド追跡策略は,人気指標一雲図に基づくトレンド追跡策略である.この策略は,一雲図の転換線を事前に買い売りシグナルを発信して,トレンドの事前のキャプチャを実現する.同時に,策略は,均線のトレンド判断を融合させ,多層の確認を行い,偽突破を避ける.
この戦略は,主に以下のポイントに基づいています.
変換線 (Conversion Line) と基準線 (Base Line) を使って雲図を構成し,26周期位移りで雲図を描画する.
閉盘価格が雲図上軌を突破すると,買入シグナルを発信し,閉盘価格が雲図下軌を突破すると,売り出シグナルを発信する.
フェイクブレイクをフィルターするには,現在の閉盘価格が変換線と基準線の最大値と最小値を同時に破る必要があります.
ストップラインは入場価格の5%に設定され,オフにすることができます.
このような複数のフィルタリングにより,トレンドの転換点を効果的に識別し,新しい取引機会を間に合うように捕捉できます.また,厳格な突破フィルタリングによって,偽の信号の発生を減らすことができます.
この戦略には以下の利点があります.
この戦略には以下のリスクがあります.
リスクは以下の方法で軽減できます.
この戦略は,以下の点で最適化できます.
ポジション管理メカニズムを追加し,strategy.position_size貯蔵庫の割合をコントロールする
種別フィルターを増やすことsecurity()品種プールをフィルタリングし,トレンドを自動認識する程度.
ストップ・ストップ・ストップ戦略を追加し,移動ストップまたは部分ストップを設定し,リスクをさらに制御する.
ブリンライン,RSIなどの他の指標と組み合わせて,多指標取引システムを構築し,信号の質を向上させる.
機械学習の手法により,購入・販売の信頼性を判断し,注文数を動的に調整する.
一雲二次予知チャンス均線トレンド追跡戦略は,一雲図によるトレンドの実現の予見判断,再融合均線多層フィルターにより,高品質の取引機会を効果的に識別することができる.戦略は,より堅牢であり,最適化スペースは大きい.実盤取引に広く適用できる.
/*backtest
start: 2022-12-05 00:00:00
end: 2023-12-11 00:00:00
period: 1d
basePeriod: 1h
exchanges: [{"eid":"Futures_Binance","currency":"BTC_USDT"}]
*/
// This source code is subject to the terms of the Mozilla Public License 2.0 at https://mozilla.org/MPL/2.0/
// © QuantCT
//@version=4
strategy("Ichimoku Cloud Strategy Idea",
shorttitle="Ichimoku",
overlay=true,
pyramiding=0,
default_qty_type=strategy.percent_of_equity,
default_qty_value=99,
initial_capital=1000,
commission_type=strategy.commission.percent,
commission_value=0.1)
// ____ Inputs
conversion_period = input(9, minval=1, title="Conversion Line Period")
base_period = input(26, minval=1, title="Base Line Period")
lagging_span2_period = input(52, minval=1, title="Lagging Span 2 Period")
displacement = input(26, minval=1, title="Displacement")
long_only = input(title="Long Only", defval=false)
slp = input(title="Stop-loss (%)", minval=1.0, maxval=25.0, defval=5.0)
use_sl = input(title="Use Stop-Loss", defval=false)
// ____ Logic
donchian(len) => avg(lowest(len), highest(len))
conversion_line = donchian(conversion_period)
base_line = donchian(base_period)
lead_line1 = avg(conversion_line, base_line)
lead_line2 = donchian(lagging_span2_period)
chikou = close
chikou_free_long = close > high[displacement] and close > max(lead_line1[2 * displacement], lead_line2[2 * displacement])
enter_long = chikou_free_long and close > max(lead_line1[displacement], lead_line2[displacement])
exit_long = close < lead_line1[displacement] or close < lead_line2[displacement]
chikou_free_short = close < low[displacement] and close < min(lead_line1[2 * displacement], lead_line2[2 * displacement])
enter_short = chikou_free_short and close < min(lead_line1[displacement], lead_line2[displacement])
exit_short = close > lead_line1[displacement] or close > lead_line2[displacement]
strategy.entry("Long", strategy.long, when=enter_long)
strategy.close("Long", when=exit_long)
if (not long_only)
strategy.entry("Short", strategy.short, when=enter_short)
strategy.close("Short", when=exit_short)
// ____ SL
sl_long = strategy.position_avg_price * (1- (slp/100))
sl_short = strategy.position_avg_price * (1 + (slp/100))
if (use_sl)
strategy.exit(id="SL", from_entry="Long", stop=sl_long)
strategy.exit(id="SL", from_entry="Short", stop=sl_short)
// ____ Plots
colors =
enter_long ? #27D600 :
enter_short ? #E30202 :
color.orange
p1 = plot(lead_line1, offset = displacement, color=colors,
title="Lead 1")
p2 = plot(lead_line2, offset = displacement, color=colors,
title="Lead 2")
fill(p1, p2, color = colors)
plot(chikou, offset = -displacement, color=color.blue)