移動平均クロスオーバー戦略を突破する


作成日: 2023-12-12 17:43:19 最終変更日: 2023-12-12 17:43:19
コピー: 1 クリック数: 929
1
フォロー
1621
フォロワー

移動平均クロスオーバー戦略を突破する

概要

この策略は,順勢突破均線交差策略と呼ばれる.主な考えは,順勢指数と均線交差を組み合わせて多空を判断することである.具体的には,この策略は,シャフトレンド周期 ((Schaff Trend Cycle,STC) 指数と二重平均線交差を使用する.STC方向が超買い超売り領域を突破し,価格が短期指数の移動平均より高く,短期指数の移動平均が長期指数の移動平均より高いとき,多空をすること;逆に,空をすること.

戦略原則

この戦略は主に2つの技術指標に基づいています.

  1. 順勢指標:STC指標,トレンドの方向を判断する. STS指標は,MACD指標,Stoch指標,STC指標ラインを含む. STCラインが0-25区間から上方突破すると多頭信号;75-100区間から下方突破すると空頭信号.

  2. 均線交差:高速簡易移動平均 ((デフォルト周期35) と遅い簡易移動平均 ((デフォルト周期200)) の交差.高速線上を通過する遅い線は多頭信号,高速線下を通過する遅い線は空頭信号.

この戦略の取引シグナル判断の論理は以下の通りです.

  1. 複数のシグナル:STC指標が25線を上方突破し,速素移動平均が速素移動平均より高く,価格が速素移動平均より高く,複数のシグナルを行う.

  2. 空白シグナル:STC指数が下方75線を突破し,快速簡易移動平均が遅速簡易移動平均より低く,価格が速速簡易移動平均より低く,空白する.

優位分析

この戦略は以下の利点があります.

  1. トレンド指標と平均線指標を組み合わせると,取引信号はより信頼性が高い. STC指標は,大トレンドの方向を判断し,双平均線は,特定の入場を判断する.

  2. 平均線パラメータは調整可能です.市場に応じて平均線パラメータを調整し,戦略を最適化できます.

  3. リスクはコントロールできる. STC指数は,超買い超売り領域を判断し,極限領域で高額な下限を追求することを避ける. 目標止損は400ポイントの止損範囲を設定している.

リスク分析

この戦略にはリスクもあります.

  1. STC指数は偽突破が発生する可能性がある.価格実体との判断を組み合わせる必要がある.

  2. 均線交差は偽信号が多く発生する可能性がある.均線周期パラメータを調整する必要がある.

  3. 単方面取引のみを行う.スペースは限られている.双方向取引も考慮できる.

  4. 外為担保取引を処理していない滑り場リスク. 固定資産の滑り場は大きい可能性があります.

最適化の方向

この戦略は以下の点で最適化できます.

  1. STCのパラメータを調整し,超買超売判断を最適化する.

  2. 均線周期を最適化して交差信号の信頼性を高める.

  3. 他の波指標を追加し,偽突破をフィルターする.例えばブリン帯.

  4. 2 方向の取引ロジックを増やす. 空間リスクを減らす.

  5. ストップ・ロジックを追加. 単一損失を制御する.

要約する

この戦略は,トレンドの方向と特定の入場ポイントを判断するために,順位指数と均線交差指数を総合的に使用しています.特定のリスク制御条件を保証すると,より良い収益を得ることができます.戦略モデルは,シンプルで明確で,容易に理解でき,また,異なる市場に応じてパラメータ調整と機能最適化を容易にし,初心者の学習と適用に適しています.
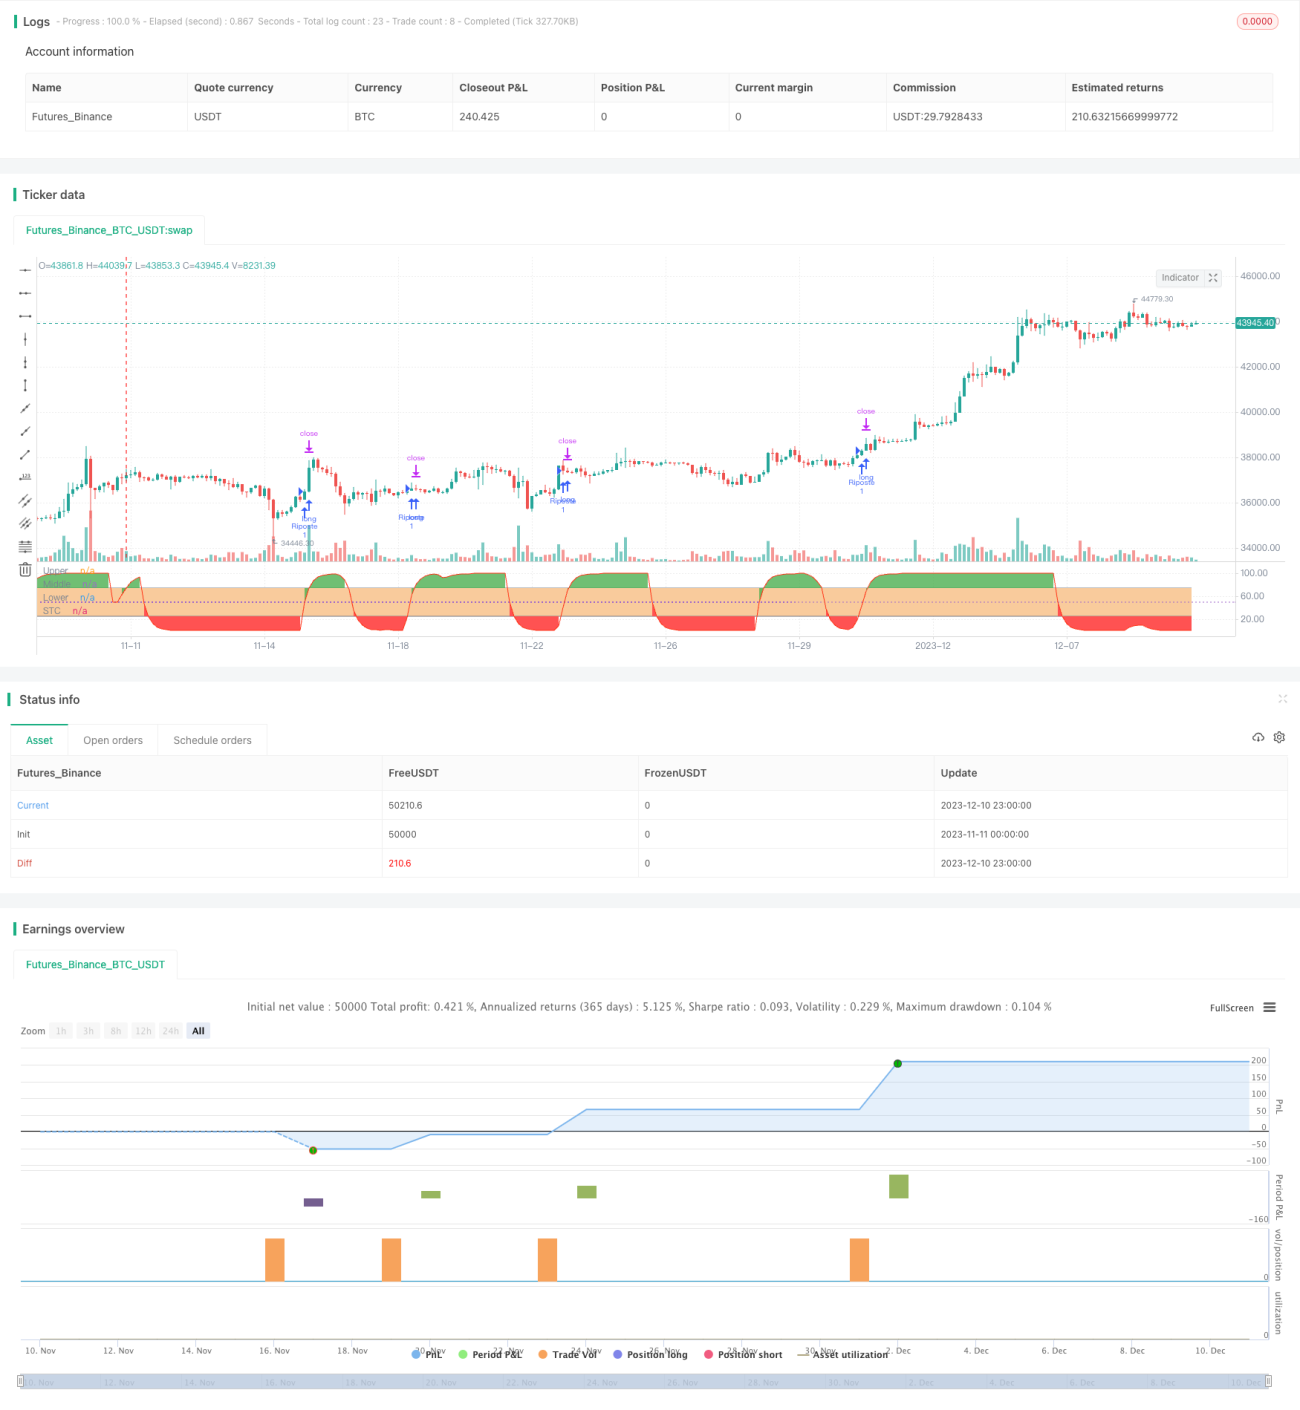
ストラテジーソースコード
/*backtest
start: 2023-11-11 00:00:00
end: 2023-12-11 00:00:00
period: 3h
basePeriod: 15m
exchanges: [{"eid":"Futures_Binance","currency":"BTC_USDT"}]
*/

//@version=4
// Shaff Trend Cycle coded by Alex Orekhov (everget)
// Strategy and its additional conditions provided by greenmask
// Schaff Trend Cycle script may be freely distributed under the MIT license.
strategy("STC", shorttitle="STC")

fastLength = input(title="MACD Fast Length", type=input.integer, defval=23)
slowLength = input(title="MACD Slow Length", type=input.integer, defval=50)
cycleLength = input(title="Cycle Length", type=input.integer, defval=10)
d1Length = input(title="1st %D Length", type=input.integer, defval=3)
d2Length = input(title="2nd %D Length", type=input.integer, defval=3)
src = close
highlightBreakouts = input(title="Highlight Breakouts ?", type=input.bool, defval=true)

macd = ema(src, fastLength) - ema(src, slowLength)
k = nz(fixnan(stoch(macd, macd, macd, cycleLength)))
d = ema(k, d1Length)
kd = nz(fixnan(stoch(d, d, d, cycleLength)))
stc = ema(kd, d2Length)
stc := 	stc > 100 ? 100 : stc < 0 ? 0 : stc
stcColor = not highlightBreakouts ? (stc > stc[1] ? color.green : color.red) : #ff3013
stcPlot = plot(stc, title="STC", color=stcColor, transp=0)
upper = 75
lower = 25
transparent = color.new(color.white, 100)
upperLevel = plot(upper, title="Upper", color=color.gray)
hline(50, title="Middle", linestyle=hline.style_dotted)
lowerLevel = plot(lower, title="Lower", color=color.gray)

fill(upperLevel, lowerLevel, color=#f9cb9c, transp=90)

upperFillColor = stc > upper and highlightBreakouts ? color.green : transparent
lowerFillColor = stc < lower and highlightBreakouts ? color.red : transparent

fill(upperLevel, stcPlot, color=upperFillColor, transp=80)
fill(lowerLevel, stcPlot, color=lowerFillColor, transp=80)
strategy.initial_capital = 50000
ordersize=floor(strategy.initial_capital/close)
targetvalue = input(title="Target/stop", type=input.integer, defval=400)

ma1length = input(title="SMA1", type=input.integer, defval=35)
ma2length = input(title="SMA2", type=input.integer, defval=200)
ma1 = ema(close,ma1length)
ma2 = ema(close,ma2length)

bullbuy = crossover(stc, lower) and ma1>ma2 and close>ma1
bearsell = crossunder(stc, upper) and ma1<ma2 and close<ma1

if (bullbuy)
    strategy.entry("Riposte", strategy.long, ordersize)
    strategy.exit( "Riposte close", from_entry="Riposte", qty_percent=100, profit=targetvalue,loss=targetvalue)

if (bearsell)
    strategy.entry("Riposte", strategy.short, ordersize)
    strategy.exit( "Riposte close", from_entry="Riposte", qty_percent=100, profit=targetvalue,loss=targetvalue)

//plotshape(bullbuy,  title= "Purple", location=location.belowbar, color=#006600, transp=0, style=shape.circle, size=size.tiny, text="Riposte")
//plotshape(bearsell,  title= "Purple", location=location.abovebar, color=#006600, transp=0, style=shape.circle, size=size.tiny, text="Riposte")