トレンドフォローRafaelZioniモメンタム戦略


作成日: 2023-12-13 14:59:34 最終変更日: 2023-12-13 14:59:34
コピー: 0 クリック数: 733
1
フォロー
1621
フォロワー

トレンドフォローRafaelZioniモメンタム戦略

概要

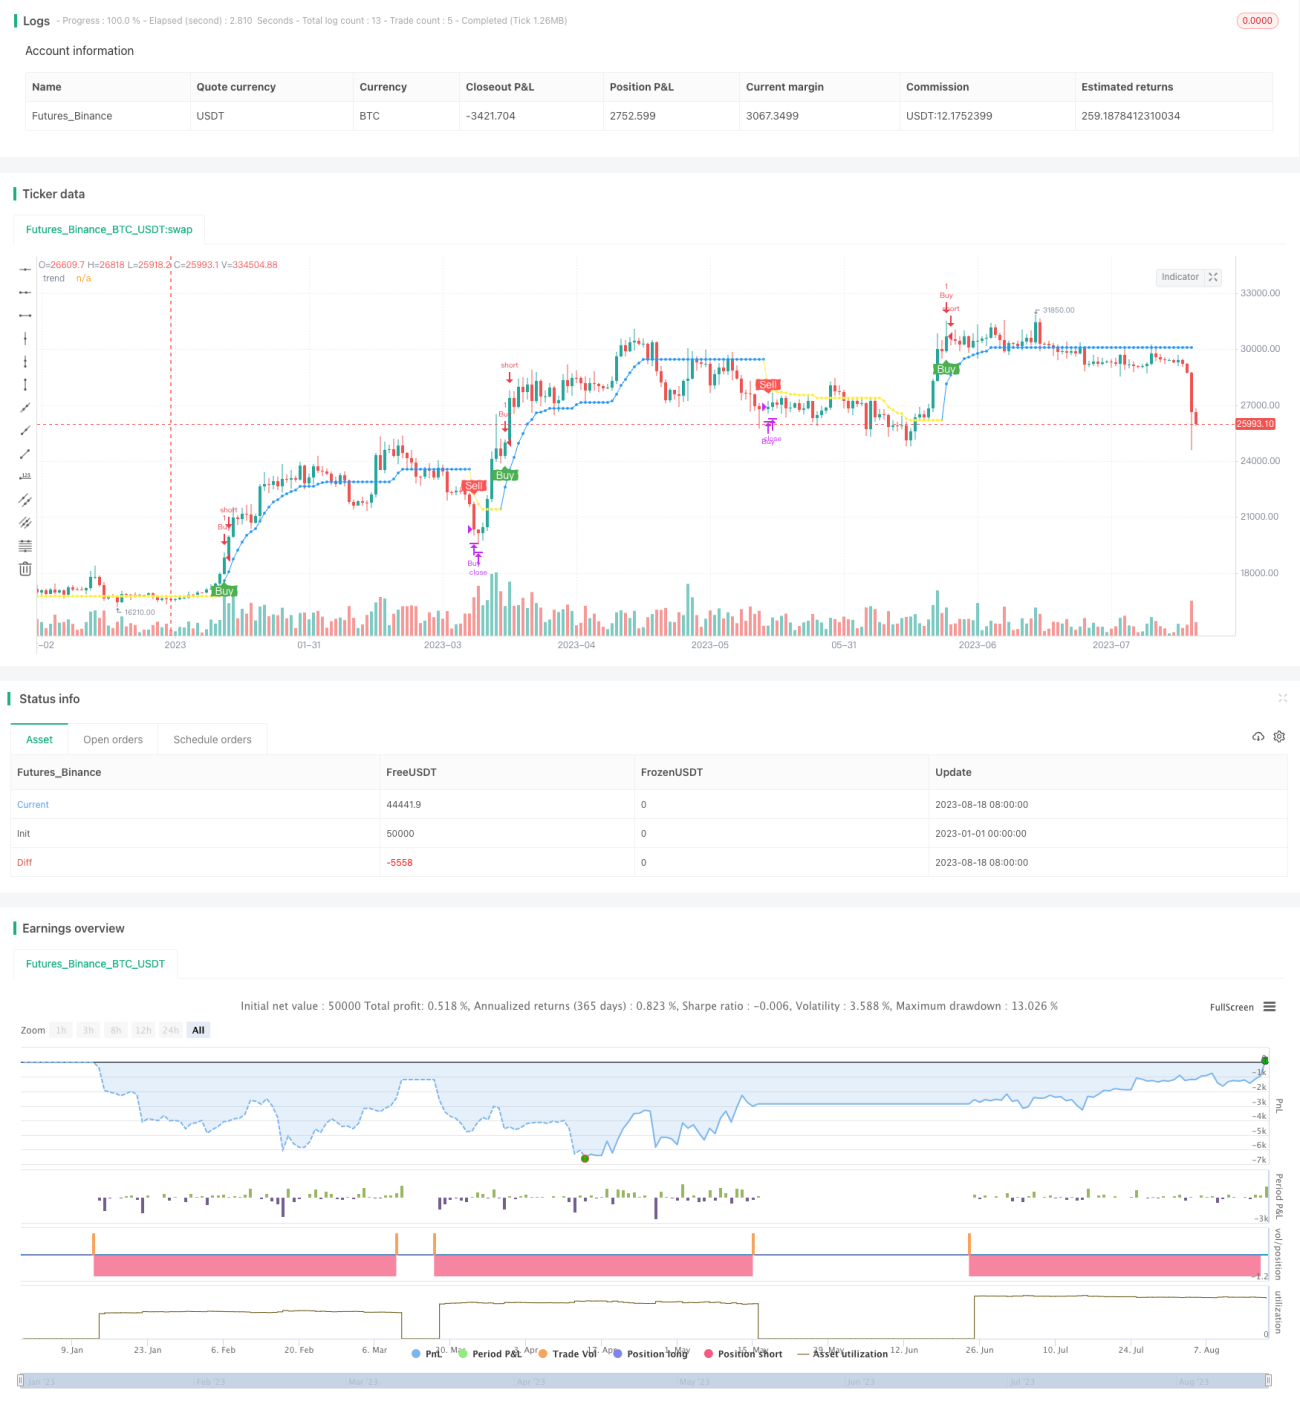
この戦略は,ラファエル・ツィオニのスーパーB指標に基づいている.動量指標によってトレンドを識別し,上昇傾向と下降傾向の自動追跡を実現し,トレンド追跡型の戦略である.

戦略原則

この戦略は,Rafael ZioniのSuperB指標を使用して価格の傾向を識別する.SuperB指標は,価格の波動範囲,取引量,開盘価格と閉盘価格の価格差をベースに計算されるSpreadVol指標である.SpreadVol指標は,価格の動量特性を反映する.この戦略は,SpreadVol指標の移動平均と標準差を使用して,値下げを決定し,SpreadVolが上位であれば上昇傾向で,下位であれば下落傾向である.

この戦略は,最高価格,最低価格を追跡してリアルタイムでトレンド転換を判断する.上昇傾向では,最高価格は常に創新高で,継続的な上昇として判断する.価格が最高価格の一定比率を下回ると,下降傾向に転換する.下降傾向では,判断方法が類似する.このようにして,トレンド転換点をタイムリーで判断することができる.

利点

この戦略は,動量指標とトレンドの方向を判断し,最大値と最小値のリアルタイム追跡を組み合わせて,新しいトレンドの方向を迅速に識別し,上昇と下降のトレンドの自動追跡を実現し,買入点と超買入点のリスクを回避します.

RafaelZioniのSuperB指標は,価格の変化の強さと速度を反映し,真のトレンドを正確に判断し,偽の突破を効果的にフィルターします.判断の規則はシンプルで明確で,容易に理解し,検証できます.

複数頭ポジションのみで,操作頻度がもたらす取引コストとスライドポイントの損失を削減します.

リスク

この策略は,突破前の整合領域に対して,複数の誤取引を容易にする.パラメータを最適化することで,整合領域に対する感受性を低下させることができる.

トレンドが揺れると,ストップラインが触発されやすい. ストップラインの範囲を適切に放宽して,より長くポジションを保持することができます.

多空変換では,適時にポジションを切り替える必要がある.適時に切り替えないと,大きな損失を招く可能性がある.

改善の提案

SuperB指標のパラメータを最適化し,より良いパラメータ組み合わせを探し,指標の安定性を向上させる.

最高価格最低価格の追跡の比率因子を最適化し,整合区域に対する反応感性を低下させる.

トレンドの揺れの間,損失を避けるために,ポジションの保持時間基準を増やす.

要約する

この戦略は,価格のトレンド方向を判断するためにRafaelZioniのSuperB指標を使用し,最高価格と最低価格をリアルタイムで追跡することでトレンド転換を判断し,上昇と下降のトレンドを自動で追跡し,過剰購入のリスクを回避し,トレンド追跡型の動量戦略に属します.この戦略は,動量指標と組み合わせて真のトレンドを判断し,判断ルールはシンプルで明確で,最適化勧告に基づいてさらに改善と最適化することができ,研究と応用に値します.

ストラテジーソースコード
/*backtest
start: 2023-01-01 00:00:00
end: 2023-08-19 00:00:00
period: 1d
basePeriod: 1h
exchanges: [{"eid":"Futures_Binance","currency":"BTC_USDT"}]
*/

//@version=4

strategy(shorttitle='SuperB', title='SuperB By RafaelZioni', overlay=true)
long_only = input(title="Only Long?", defval=true)

hilow = ((high - low)*100)
openclose = ((close - open)*100)
vol = (volume / hilow)
spreadvol = (openclose * vol)
VPT = spreadvol + cum(spreadvol)
window_len = 28

v_len = 14
price_spread = stdev(high-low, window_len)

vp =  spreadvol + cum(spreadvol)
smooth = sma(vp, v_len)
v_spread = stdev(vp - smooth, window_len)
shadow = (vp - smooth) / v_spread * price_spread

out = shadow > 0 ? high + shadow : low + shadow
//

len = input(10)


vpt=ema(out,len)

// INPUTS //
st_mult   = input(1,   title = ' Multiplier', minval = 0, maxval = 100, step = 0.01)
st_period = input(10, title = ' Period',     minval = 1)

// CALCULATIONS //
up= vpt - (st_mult * atr(st_period))
dn = vpt + (st_mult * atr(st_period))
c5=close
//

factor = input(title="Factor", defval=0.05, minval=0.01, maxval=5, step=0.01, type=input.float)

hb = 0.00 ,hb := nz(hb[1])
hl = 0.000, hl := nz(hl[1])

lb = 0.00 ,lb := nz(lb[1])
l1 = 0.000,l1 := nz(l1[1])

c = 0
c := nz(c[1]) + 1

trend = 0,trend := nz(trend[1]),n = dn,x =up


if barstate.isfirst
    c := 0
    lb := n
    hb := x                      
    l1 := c5  
    hl := c5
    hl
if c == 1
    if x >= hb[1]
        hb := x
        hl := c5
        trend := 1  
        trend
    else
        lb := n
        l1 := c5 
        trend := -1 
        trend

if c > 1

    if trend[1] > 0  
        hl := max(hl[1], c5)
        if x >= hb[1] 
            hb := x
            hb
        else

            
            if n < hb[1] - hb[1] * factor 
                lb := n
                l1 := c5

                trend := -1  
                trend
    else

       
        l1 := min(l1[1], c5 )

        if n <= lb[1] 
            lb := n 
            lb
        else

           
            if x > lb[1] + lb[1] * factor
                hb := x 
                hl := c5

                trend := 1  
                trend


v = trend == 1 ? hb : trend == -1 ? lb : na
plot(v, color=trend == 1 ? color.blue : color.yellow, style=plot.style_circles, linewidth=1, title="trend", transp=0, join=true)

//

long = trend == 1 and trend[1] == -1 
short = trend == -1 and trend[1] == 1 
//
last_long = 0.0
last_short = 0.0
last_long := long ? time : nz(last_long[1])
last_short := short ? time : nz(last_short[1])

buy = crossover(last_long, last_short)
sell = crossover(last_short, last_long)

/////////////// Positions ////////////// 
if long
    strategy.entry("Buy", long=true)
    if long_only == false
        strategy.close("Sell")

if short
    if long_only == false
        strategy.entry("Sell", long=false)
    strategy.close("Buy")

/////////////// Plotting /////////////// 
plotshape(buy, title="buy", text="Buy", color=color.green, style=shape.labelup, location=location.belowbar, size=size.small, textcolor=color.white, transp=0)  //plot for buy icon
plotshape(sell, title="sell", text="Sell", color=color.red, style=shape.labeldown, location=location.abovebar, size=size.small, textcolor=color.white, transp=0)


/////////////// Alerts /////////////// 
alertcondition(buy, title='buy', message='Buy')
alertcondition(sell, title='sell', message='Sell')