モメンタムスイングトレード戦略


作成日: 2023-12-15 11:00:25 最終変更日: 2023-12-15 11:00:25
コピー: 0 クリック数: 679
1
フォロー
1621
フォロワー

モメンタムスイングトレード戦略

概要

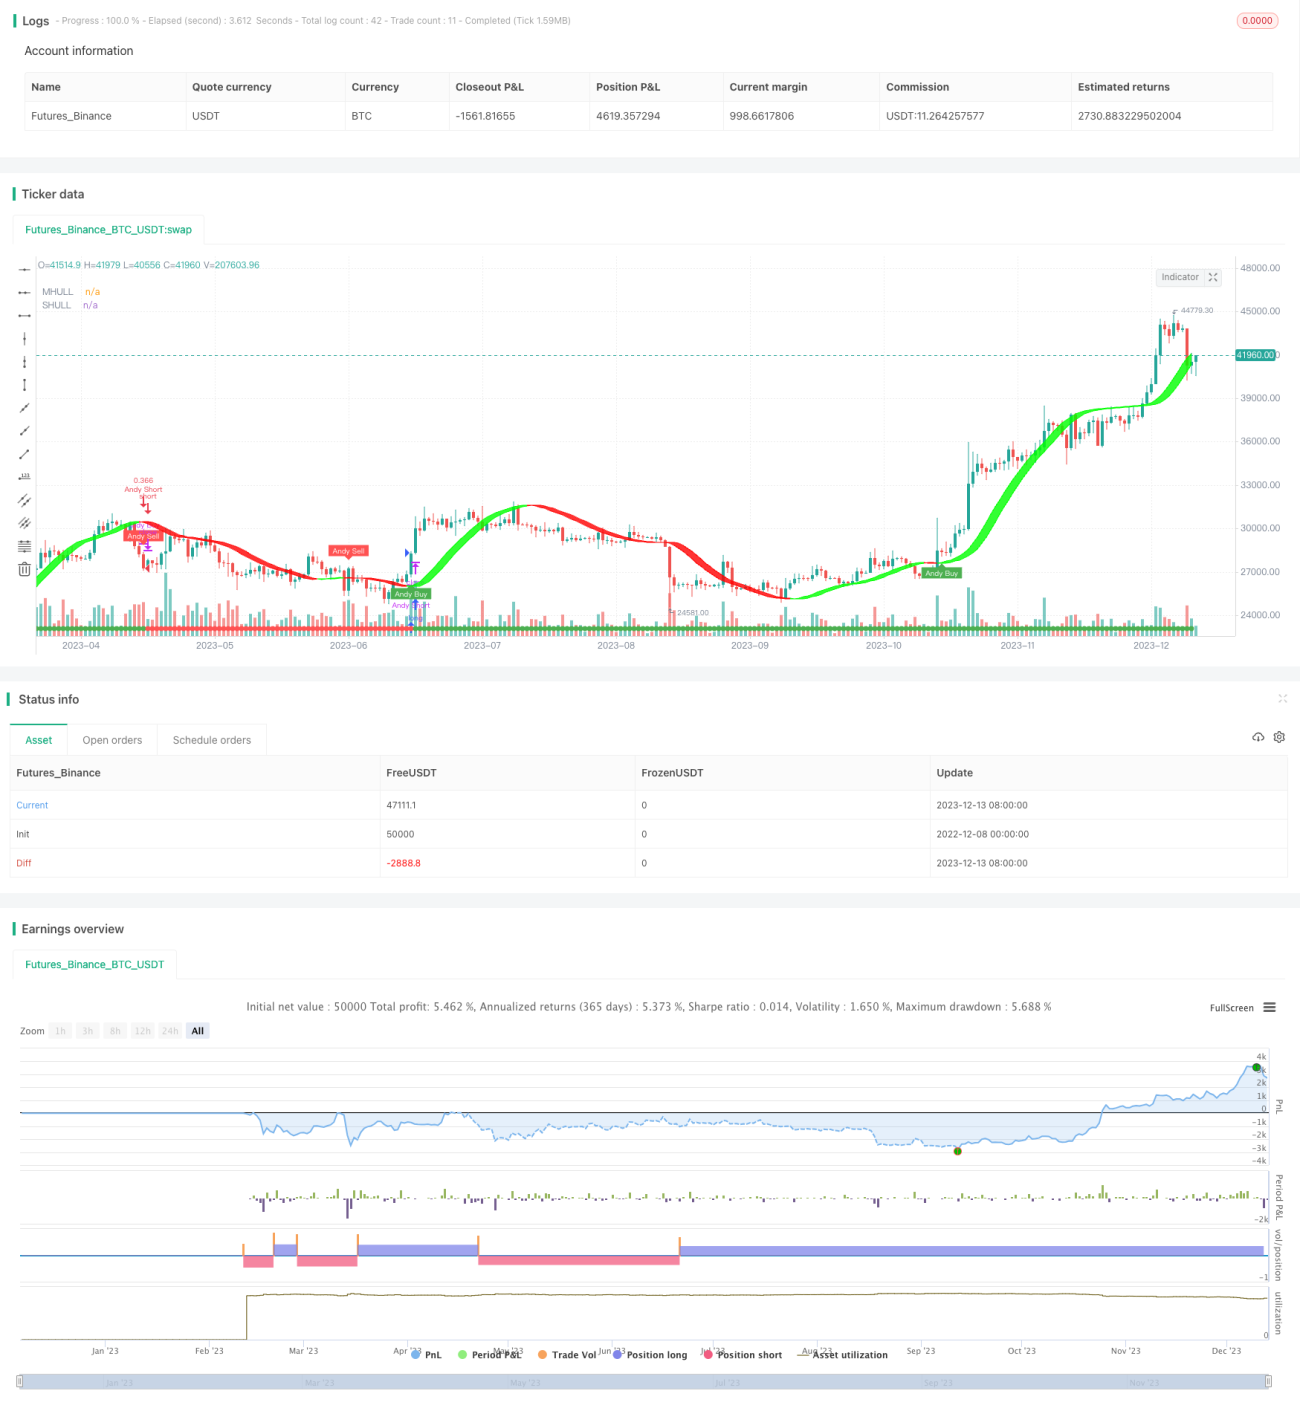
Dynamic Momentum Oscillator Trading Strategy (DMO戦略) は,動力の振動指標に基づく15分間のショートライン取引戦略である.この戦略は,複数の技術指標を組み合わせて,高精度な取引信号を実現し,初心者トレーダーに短時間で買い物決定,リスク管理,利益率の向上を効果的に支援する.

戦略原則

この戦略は,まず,Doinchianチャネルを使用して市場の主要トレンドの方向を判断する.価格がチャネルを突破すると,上沿いに見張りの信号であり,下沿いに突破すると,下向きの信号である.次に,戦略は,3種類のHull移動平均変数の1つを採用し,ATRチャネルに自律的に適応したより正確なトレンド判断を実現する.ショートラインで中間線を突破すると,買いの信号で,下線は販売の信号である.最後に,半整数平均指数の補助と組み合わせて,偽の部分信号をフィルターして,信号の信頼性を高める.より信頼できる取引信号を学んだ後,戦略は,対応する多頭空頭ポジションに入ります.

優位分析

DMO戦略の最大の利点は,複数の指標の有機的な組み合わせであり,異なる指標が相互に検証でき,偽信号をフィルターすることで,取引の信号をより精密に信頼できるようにするものである.さらに,ドインチアンチャネルは,主動トレンドを判断する方法は単純で直接であり,半整平均線フィルター信号の手段も従来的であり,全体的に理解しやすいため,初心者にとっては難しくない.単一の指標と比較して,DMOは,同じ取引回数でより高い勝利率と収益率を得ることができる.

リスク分析

DMO戦略は安定して信頼性があるが,いかなる量化取引戦略にも必ずある程度のリスクがある.具体的には,快線と中線がデッドフォークを生じると,他の指標の検証がなければ,偽信号である可能性もある.また,すべてのショートライン戦略と同様に,DMOは一定の過剰取引リスクに直面している.市場突発事件が指標の失敗につながると,停止損失の設定が不適切であれば,大きな損失も引き起こされる.リスクを減らすために,中長期指標のパラメータを適切に調整し,より高い時間周期の指標と組み合わせてテストすることをお勧めする.同時に,大きな損失距離を加え,単一の損失を厳格に制御する.

最適化の方向

DMO戦略は,次のいくつかの次元から最適化することができる:第一に,Hull MAのパラメータを調整し,移動平均の長さを最適化し,平滑効果と感度とのバランスをとる.第二に,Doinchian通路判断論理を改良し,通路パラメータを調整するか,追加条件の入場制限を加える.第三に,ブリンベルト,KDJなどの半整体平均の代わりに他の指標を試し,補助フィルタリング効果を向上させる.第四に,異なる品種の特徴に応じて適切な取引区間を指定し,例えば5分または30分に変更する.

要約する

DMOは,複数の指標の最適化ポートフォリオのショートライン戦略である.それは,ドインチアンチャネル,ハルMAおよび半整平均を融合し,市場動向を効果的に判断し,正確な取引信号を生成する.戦略手段は,比較的シンプルで直観的で,操作の難しさはあまり多くなく,新人の入門戦略として使用できる.単一の指標と比較して,DMOは,より高い取引勝利率と収益率を生成する.参数調整,組合せの改善,取引区間指定などの措置により,DMO戦略は,長期的により安定した優異的パフォーマンスを得ることを期待する.

ストラテジーソースコード
/*backtest
start: 2022-12-08 00:00:00
end: 2023-12-14 00:00:00
period: 1d
basePeriod: 1h
exchanges: [{"eid":"Futures_Binance","currency":"BTC_USDT"}]
*/

// This source code is subject to the terms of the Mozilla Public License 2.0 at https://mozilla.org/MPL/2.0/
// © kgynofomo

//@version=5
strategy(title="[Salavi] | Andy Super Pro Strategy [BTC|M15]",overlay = true, pyramiding = 1,initial_capital = 10000, default_qty_type = strategy.cash,default_qty_value = 10000)

//Doinchian Trend Ribbon
dlen = input.int(defval=30, minval=10)

dchannel(len) =>
    float hh = ta.highest(len)
    float ll = ta.lowest(len)

    int trend = 0
    trend := close > hh[1] ? 1 : close < ll[1] ? -1 : nz(trend[1])
    trend

dchannelalt(len, maintrend) =>
    float hh = ta.highest(len)
    float ll = ta.lowest(len)

    int trend = 0
    trend := close > hh[1] ? 1 : close < ll[1] ? -1 : nz(trend[1])
    maintrend == 1 ? trend == 1 ? #00FF00ff : #00FF009f : maintrend == -1 ? trend == -1 ? #FF0000ff : #FF00009f : na

maintrend = dchannel(dlen)
donchian_bull = maintrend==1
donchian_bear = maintrend==-1


//Hulls
src = input(hlc3, title='Source')
modeSwitch = input.string('Hma', title='Hull Variation', options=['Hma', 'Thma', 'Ehma'])
length = input(55, title='Length')
lengthMult = input(1.0, title='Length multiplier ')

useHtf = false
htf = '240'

switchColor = true
candleCol = false
visualSwitch = true
thicknesSwitch = 1
transpSwitch = 40

//FUNCTIONS
//HMA
HMA(_src, _length) =>
    ta.wma(2 * ta.wma(_src, _length / 2) - ta.wma(_src, _length), math.round(math.sqrt(_length)))
//EHMA    
EHMA(_src, _length) =>
    ta.ema(2 * ta.ema(_src, _length / 2) - ta.ema(_src, _length), math.round(math.sqrt(_length)))
//THMA    
THMA(_src, _length) =>
    ta.wma(ta.wma(_src, _length / 3) * 3 - ta.wma(_src, _length / 2) - ta.wma(_src, _length), _length)

//SWITCH
Mode(modeSwitch, src, len) =>
    modeSwitch == 'Hma' ? HMA(src, len) : modeSwitch == 'Ehma' ? EHMA(src, len) : modeSwitch == 'Thma' ? THMA(src, len / 2) : na

//OUT
_hull = Mode(modeSwitch, src, int(length * lengthMult))
HULL = useHtf ? request.security(syminfo.ticker, htf, _hull) : _hull
MHULL = HULL[0]
SHULL = HULL[2]

//COLOR
hullColor = switchColor ? HULL > HULL[2] ? #00ff00 : #ff0000 : #ff9800
hull_bull = HULL > HULL[2]
bull_start = hull_bull and hull_bull[1]==false
hull_bear = HULL < HULL[2]
bear_start = hull_bear and hull_bear[1]==false

barcolor(color=candleCol ? switchColor ? hullColor : na : na)

//halftrend
amplitude = input(title='Amplitude', defval=2)
channelDeviation = input(title='Channel Deviation', defval=2)
// showArrows = input(title='Show Arrows', defval=true)
// showChannels = input(title='Show Channels', defval=true)

var int trend = 0
var int nextTrend = 0
var float maxLowPrice = nz(low[1], low)
var float minHighPrice = nz(high[1], high)

var float up = 0.0
var float down = 0.0
float atrHigh = 0.0
float atrLow = 0.0
float arrowUp = na
float arrowDown = na

atr2 = ta.atr(100) / 2
dev = channelDeviation * atr2

highPrice = high[math.abs(ta.highestbars(amplitude))]
lowPrice = low[math.abs(ta.lowestbars(amplitude))]
highma = ta.sma(high, amplitude)
lowma = ta.sma(low, amplitude)

if nextTrend == 1
    maxLowPrice := math.max(lowPrice, maxLowPrice)

    if highma < maxLowPrice and close < nz(low[1], low)
        trend := 1
        nextTrend := 0
        minHighPrice := highPrice
        minHighPrice
else
    minHighPrice := math.min(highPrice, minHighPrice)

    if lowma > minHighPrice and close > nz(high[1], high)
        trend := 0
        nextTrend := 1
        maxLowPrice := lowPrice
        maxLowPrice

if trend == 0
    if not na(trend[1]) and trend[1] != 0
        up := na(down[1]) ? down : down[1]
        arrowUp := up - atr2
        arrowUp
    else
        up := na(up[1]) ? maxLowPrice : math.max(maxLowPrice, up[1])
        up
    atrHigh := up + dev
    atrLow := up - dev
    atrLow
else
    if not na(trend[1]) and trend[1] != 1
        down := na(up[1]) ? up : up[1]
        arrowDown := down + atr2
        arrowDown
    else
        down := na(down[1]) ? minHighPrice : math.min(minHighPrice, down[1])
        down
    atrHigh := down + dev
    atrLow := down - dev
    atrLow

ht = trend == 0 ? up : down

var color buyColor = color.blue
var color sellColor = color.red

htColor = trend == 0 ? buyColor : sellColor
// htPlot = plot(ht, title='HalfTrend', linewidth=2, color=htColor)

// atrHighPlot = plot(showChannels ? atrHigh : na, title='ATR High', style=plot.style_circles, color=color.new(sellColor, 0))
// atrLowPlot = plot(showChannels ? atrLow : na, title='ATR Low', style=plot.style_circles, color=color.new(buyColor, 0))

// fill(htPlot, atrHighPlot, title='ATR High Ribbon', color=color.new(sellColor, 90))
// fill(htPlot, atrLowPlot, title='ATR Low Ribbon', color=color.new(buyColor, 90))

HalfTrend_buySignal = not na(arrowUp) and trend == 0 and trend[1] == 1
HalfTrend_sellSignal = not na(arrowDown) and trend == 1 and trend[1] == 0

// plotshape(showArrows and buySignal ? atrLow : na, title='Arrow Up', style=shape.triangleup, location=location.absolute, size=size.tiny, color=color.new(buyColor, 0))
// plotshape(showArrows and sellSignal ? atrHigh : na, title='Arrow Down', style=shape.triangledown, location=location.absolute, size=size.tiny, color=color.new(sellColor, 0))


//ema
filter_ema = ta.ema(close,200)
ema_bull = close>filter_ema
ema_bear = close<filter_ema

atr_length = input.int(7)
atr = ta.atr(atr_length)
atr_rsi_length = input.int(50)
atr_rsi = ta.rsi(atr,atr_rsi_length)
atr_valid = atr_rsi>50

longCondition = bull_start and atr_valid
shortCondition = bear_start and atr_valid

Exit_long_condition = shortCondition
Exit_short_condition = longCondition

if longCondition
    strategy.entry("Andy Buy",strategy.long, limit=close,comment="Andy Buy Here")

if Exit_long_condition
    strategy.close("Andy Buy",comment="Andy Buy Out")
    // strategy.entry("Andy fandan Short",strategy.short, limit=close,comment="Andy 翻單 short Here")
    // strategy.close("Andy fandan Buy",comment="Andy short Out")


if shortCondition
    strategy.entry("Andy Short",strategy.short, limit=close,comment="Andy short Here")


// strategy.exit("STR","Long",stop=longstoploss)
if Exit_short_condition
    strategy.close("Andy Short",comment="Andy short Out")
    // strategy.entry("Andy fandan Buy",strategy.long, limit=close,comment="Andy 翻單 Buy Here")
    // strategy.close("Andy fandan Short",comment="Andy Buy Out")


inLongTrade = strategy.position_size > 0
inLongTradecolor = #58D68D
notInTrade = strategy.position_size == 0
inShortTrade = strategy.position_size < 0

// bgcolor(color = inLongTrade?color.rgb(76, 175, 79, 70):inShortTrade?color.rgb(255, 82, 82, 70):na)
plotshape(close!=0,location = location.bottom,color = inLongTrade?color.green:inShortTrade?color.red:na)


plotshape(longCondition, title='Buy', text='Andy Buy', style=shape.labelup, location=location.belowbar, color=color.new(color.green, 0), textcolor=color.new(color.white, 0), size=size.tiny)
plotshape(shortCondition, title='Sell', text='Andy Sell', style=shape.labeldown, location=location.abovebar, color=color.new(color.red, 0), textcolor=color.new(color.white, 0), size=size.tiny)

Fi1 = plot(MHULL, title='MHULL', color=hullColor, linewidth=thicknesSwitch, transp=50)
Fi2 = plot(SHULL, title='SHULL', color=hullColor, linewidth=thicknesSwitch, transp=50)

fill(Fi1, Fi2, title='Band Filler', color=hullColor, transp=transpSwitch)