ダブル移動平均 3 指数インジケーター取引戦略


作成日: 2023-12-15 15:39:45 最終変更日: 2023-12-15 15:39:45
コピー: 0 クリック数: 603
1
フォロー
1621
フォロワー

ダブル移動平均 3 指数インジケーター取引戦略

概要

この戦略は,双均線指数と三指数均線指数を用い,ランダムな指数と組み合わせて,より安定した信頼性の高いトレンド追跡取引戦略を形成する.この戦略の主な考えは,均線指数の判断が金叉または死叉の出現時に取引シグナルを発信することであり,ランダムな指数は,市場が激しく波動するときに誤ったシグナルを発生させないように,超買い超売状況を判断するのに役立ちます.

原則

この戦略は以下の4つの部分から構成されています.

  1. 双均線指標:それぞれ50周期および100周期の指数移動平均 ((EMA) を計算し,短期EMAの上を長期EMA穿越すると買入シグナルを生じ,下を穿越すると売出シグナルを生じます.

  2. 三指数指標:それぞれ50周期,100周期,200周期の指数移動平均を計算し,市場トレンドの方向性を判断する.50EMA>100EMA>200EMAが多頭市場であり,50EMA<100EMA<200EMAが空頭市場である.

  3. ランダム指標:RSIの6日K値とD値を計算し,超買超売状況を判断する.K値の上を通過すると超売,下を通過すると超買となる.

  4. 取引シグナル: 市場が3指数平均線の多頭または空頭状態に適合する場合は,双均線指標が同時に信号を生成するのみで,ランダムな指標がオーバーバイオーバーセールを示さない場合に真の取引指示を発行する.

利点

この戦略は,均線指標とランダム指標を総合的に使用し,取引信号を発信する際にトレンド方向の判断を考慮するとともに,市場の過剰買い過剰売り状態を参考にして,よりよい騒音をフィルタリングし,より明確なトレンドを追跡することができる.また,全体的なトレンドを判断するために3つの指数均線を採用し,信号をより信頼性のあるものにする.この戦略は,簡単に理解し,容易に実施し,容易に最適化することができる.

リスクと対策

この戦略の最大のリスクは,指標判断に依存していることであり,指標が誤った信号を発している場合,取引の失敗を引き起こす可能性があります.さらに,長期の周期平均線指標を使用して全体的な傾向を判断すると,短期的な機会を逃す可能性があります.主なリスク対策は以下のとおりです.

  1. 指数パラメータを最適化し,二次平均線と三次平均線の周期组合を調整し,市場特性により適合させる.

  2. 複数の指標を組み合わせてCANCEL操作を行い,市場が激しく波動すると判断したときに現在の取引を中止する.

  3. ショートライン多頭戦略を用いて,ロングライン多頭市場における短期的機会を利用して利益を得る.

最適化の方向

この戦略は,以下のような点で最適化できます.

  1. 二重平均線と三指数平均線の周期パラメータを調整し,市場特性を順守する指標を最適化する.

  2. VOLUMEやMACDなどの指標の判断を増やして,価格異常が誤信号を発生させないようにする.

  3. 短時間後退の誤信号を避けるために,トレンドを確認するために,Candleモードを使用します.

  4. 株や外貨などに拡大し,戦略の適応性を検証する.

  5. VIX指数と組み合わせて,全体的な市場の変動率を判断し,ポジションの規模を制御する.

要約する

この戦略は,二均線指標を交易信号に,三均線指標とランダム指標を補助判断に利用して,より安定したトレンド追跡戦略を構築する.それは,単純に分かりやすく,実行しやすい,市場特性にマッチング度が高い,収益はより安定している,推奨すべき定量化戦略である.ターゲティング最適化により,より良い効果が得られる見込みがある.
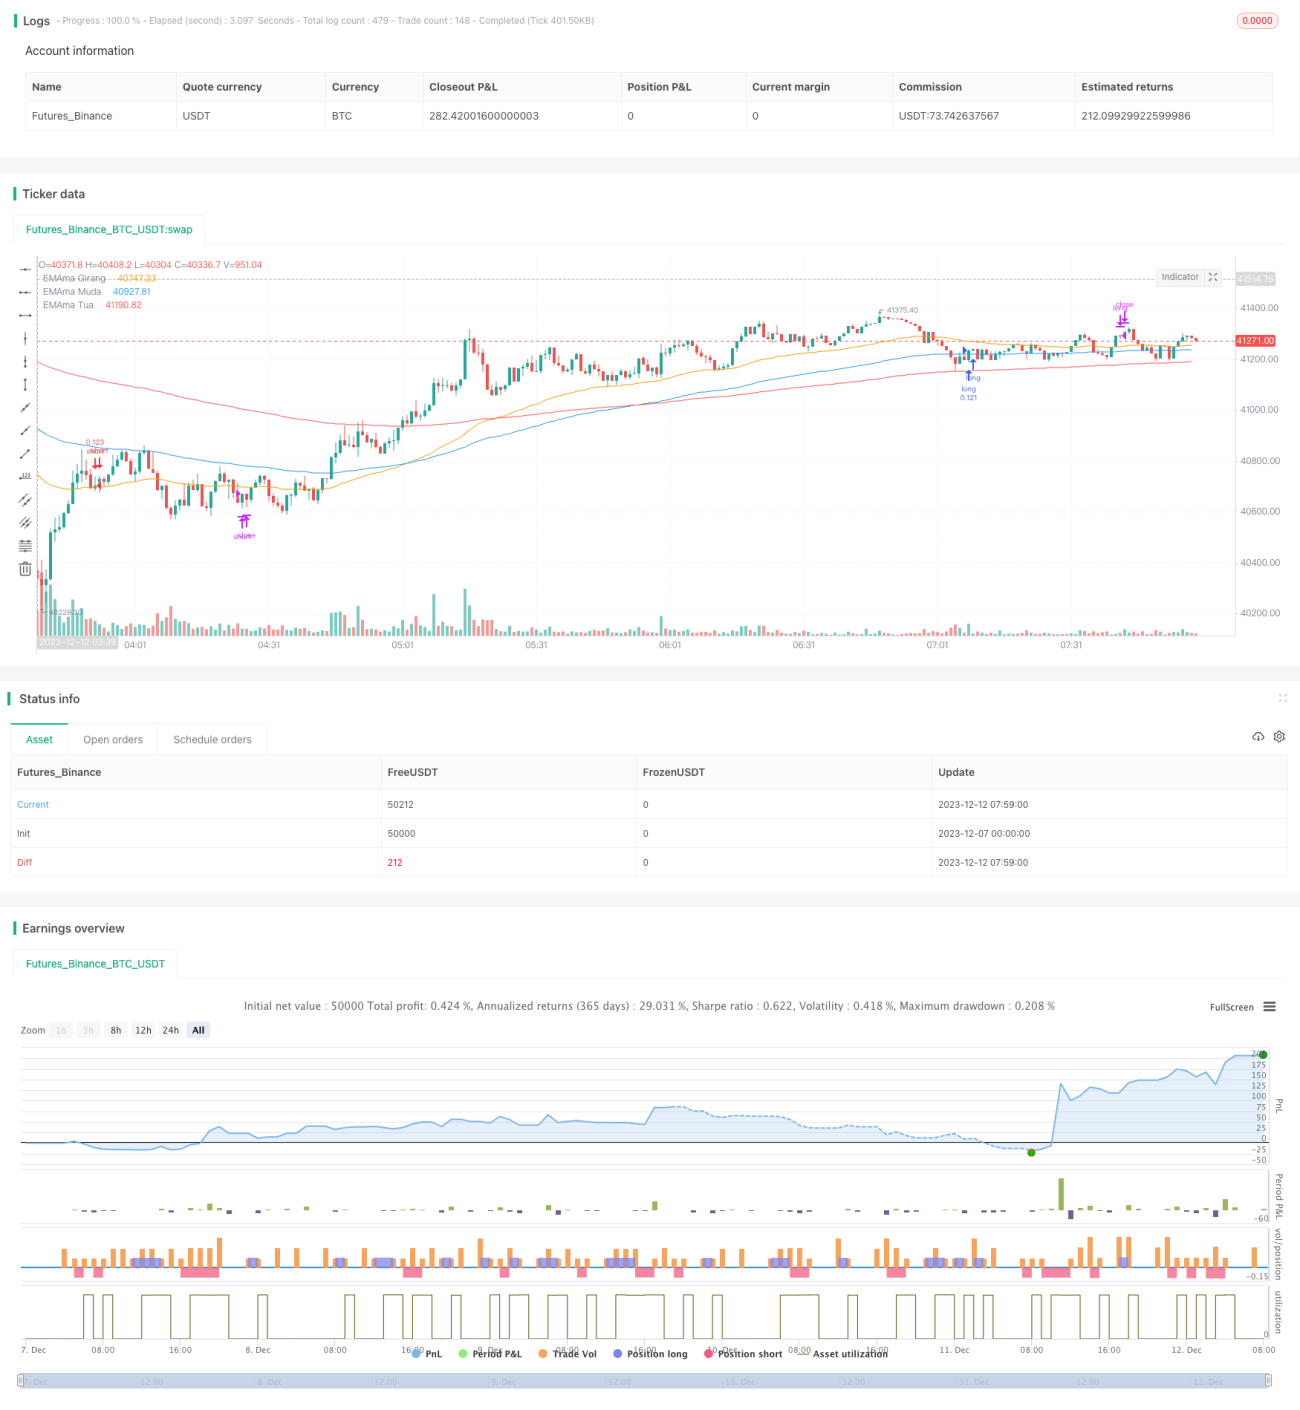
ストラテジーソースコード
/*backtest
start: 2023-12-07 00:00:00
end: 2023-12-12 08:00:00
period: 1m
basePeriod: 1m
exchanges: [{"eid":"Futures_Binance","currency":"BTC_USDT"}]
*/

//@version=5
strategy(title='5212 EMA Strategy', shorttitle='5212 EMA', overlay=true, pyramiding=0, default_qty_type=strategy.percent_of_equity, default_qty_value=10, calc_on_every_tick=false)

//**Backtest Date sof
useStartPeriodTime  = input.bool(true                       , 'Start Date & Time'   , group='Date Range'    , inline='Start Period')
startPeriodTime     = input(timestamp('16 Apr 2021')   , ''                    , group='Date Range'    , inline='Start Period')
useEndPeriodTime    = input.bool(false                      , 'End Date & Time'     , group='Date Range'    , inline='End Period')
endPeriodTime       = input(timestamp('31 Dec 2222')   , ''                    , group='Date Range'    , inline='End Period')
enableHighlight     = input.bool(false                      , 'Highlight'           , group='Date Range'    , inline='Highlight')
highlightType       = input.string('Anchors'                , ''                    , group='Date Range'    , inline='Highlight'    , options=['Anchors', 'Background'])
highlightColor      = input.color(color.white               , ''                    , group='Date Range'    , inline='Highlight')
start = useStartPeriodTime ? startPeriodTime >= time : false
end = useEndPeriodTime ? endPeriodTime <= time : false
calcPeriod = true
// var line startAnchor    = line.new(na, na, na, na, xloc.bar_time, extend.both, highlightColor, width=2)
// var line endAnchor      = line.new(na, na, na, na, xloc.bar_time, extend.both, highlightColor, width=2)
// useBgcolor = false
// if enableHighlight
//     if highlightType == 'Anchors'
//         if useStartPeriodTime
//             line.set_xy1(startAnchor, startPeriodTime, low)
//             line.set_xy2(startAnchor, startPeriodTime, high)
//         if useEndPeriodTime
//             line.set_xy1(endAnchor, calcPeriod ? time : line.get_x1(endAnchor), low)
//             line.set_xy2(endAnchor, calcPeriod ? time : line.get_x1(endAnchor), high)

//     if highlightType == 'Background'
//         useBgcolor := true
//         useBgcolor

// bgcolor(useBgcolor and calcPeriod ? color.new(highlightColor,90) : na, editable=false)
//**Backtest Date eof

src         =input(close    , 'Source'      , group='Support')
showEMA     = input(true    , 'Show EMA'    , group='Support')

//**Stochastic RSI sof
smoothK     = input.int(6   , "K"               , group='Stochastic RSI'    , minval=1)
smoothD     = input.int(6   , "D"               , group='Stochastic RSI'    , minval=1)
lengthRSI   = input.int(28  , "RSI Length"      , group='Stochastic RSI'    , minval=1)
lengthStoch = input.int(28  , "Stoch Length"    , group='Stochastic RSI'    , minval=1)

rsi1    = ta.rsi(src, lengthRSI)
k       = ta.sma(ta.stoch(rsi1, rsi1, rsi1, lengthStoch), smoothK)
d       = ta.sma(k, smoothD)
//**STochastic RSI eof

//** EMA sof
emain01     = input.int(50  , "EMAma Girang"    , group='Moving Average Exponential'    , minval=1)
emain02     = input.int(100 , "EMAma Muda"      , group='Moving Average Exponential'    , minval=1)
emain03     = input.int(200 , "EMAma Tua"       , group='Moving Average Exponential'    , minval=1)

ema01 = ta.ema(src, emain01)
ema02 = ta.ema(src, emain02)
ema03 = ta.ema(src, emain03)
plot(showEMA ? ema01 : na, 'EMAma Girang'   , color = color.new(color.orange, 0))
plot(showEMA ? ema02 : na, 'EMAma Muda'     , color = color.new(color.blue, 0))
plot(showEMA ? ema03 : na, 'EMAma Tua'      , color = color.new(color.red, 0))
//** EMA eof

//**Condition sof
emaLong     = ema01 > ema02 and ema02 > ema03 and low > ema03
emaShort    = ema01 < ema02 and ema02 < ema03 and high < ema03

longCond    = ta.crossover(k,d) and k <= 23 and emaLong
shortCond   = ta.crossunder(k,d) and k >= 77 and emaShort

longClose   = ta.crossunder(k,d) and k <= 77
shortClose  = ta.crossover(k,d) and k >= 23
longCross   = ta.crossover(ema01, ema02)
shortCross  = ta.crossunder(ema01, ema02)
//**Condition eof

//**Strategy sof
if calcPeriod and longCond
    strategy.entry('long', strategy.long, when=longCond, comment='EN Long')
strategy.close('long', when=shortClose, comment='EX Long')
strategy.close('long', when=shortCross, comment='MD Short')

if calcPeriod and shortCond
    strategy.entry('short', strategy.short, when=shortCond, comment='EN Short')
strategy.close('short', when=longClose, comment='EX Short')
strategy.close('short', when=longCross, comment='MD Long')

if calcPeriod == false and ta.crossover(ema01, ema02) or ta.crossunder(ema01, ema02)
    strategy.cancel('long')
    strategy.cancel('short')
//**Strategy eof

//**Label sof
entryText       = str.tostring(strategy.position_avg_price, '##.###')
longText    = 'Long Entry : ' + entryText 
shortText   = 'Short Entry : ' + entryText
noTrade     = 'Sleeping Mode'

LongTrade = strategy.position_size > 0
ShortTrade = strategy.position_size < 0

Tekslabel = LongTrade ? longText : ShortTrade ? shortText : noTrade

xPosition = timenow + math.round(ta.change(time)*1)
yPosition = ta.highest(1)
labelColor = LongTrade ? color.new(color.aqua, 0) : ShortTrade ? color.new(color.red, 0) : color.new(color.gray, 0)
textColor   = LongTrade ? color.new(color.black, 0) : ShortTrade ? color.new(color.white, 0) : color.new(color.white, 0)

// lab_l = label.new(
//           xPosition, yPosition, Tekslabel,
//           color=labelColor, 
//           textcolor=textColor, 
//           style =  label.style_label_left,
//           textalign=text.align_left,
//           xloc=xloc.bar_time, yloc = yloc.price)

// label.delete(lab_l[1])
//**Strategy eof