価格が移動平均線を突破したときの取引戦略


作成日: 2023-12-15 16:28:12 最終変更日: 2023-12-15 16:28:12
コピー: 0 クリック数: 575
1
フォロー
1621
フォロワー

価格が移動平均線を突破したときの取引戦略

概要

双方向価格ブレークスルー移動平均タイミングトレーディング戦略 (Dual Direction Price Breakthrough Moving Average Timing Trading Strategy) は,価格ブレークスルー平均線を利用して,買い売りのタイミングを判断する量的なトレーディング戦略である.この戦略は,価格を指定された周期の移動平均と比較して,価格の上破または下破平均線に基づいて取引を生成する.

戦略原則

この戦略の核心的な論理は:

  1. EMA関数を使用して指定周期 (例えば200日) の移動平均を計算する.

  2. 閉盘価格とEMAの大きさの関係を比較して,価格がEMAを突破したかどうかを判断する.具体的には,当日の閉盘価格がEMAより大きいときは,価格がEMAを穿ったと考えられる.当日の閉盘価格がEMAより小さいときは,価格がEMAを穿ったと考えられる.

  3. 値上がりと値下がりによって買いと売りのタイミングを判断する.価格がEMAを上回ったとき,買い信号が生じる.価格がEMAを下回ったとき,売り信号が生じる.

  4. シグナルが生み出されると,一定の割合で (例えば全仓) 注文し,その後,ストップ・ロズとストップ・ストップ価格を設定する.

  5. 価格がストップ・ロースまたはストップ・ストップ価格に達すると,ポジションを平らにする.

  6. 価格が平均線を突破するタイミングを利用して利益を得る.

この戦略は単純で直接的で,容易に理解し,実行できる.短線上の突破信号を捕捉することで,よりよいタイミングが得られる.しかし,一定の遅延性と複数の震動のリスクもある.

戦略的優位性

  • 戦略の論理はシンプルで明快で,理解し,検証しやすい.
  • 平均線特性を利用して,ある種のトレンド追跡能力がある.
  • 取引回数が多く,ショートライン操作に適している.
  • 価格の変化に素早く反応し,より良いタイミングを捉える.

戦略リスク

  • 価格の初期突破を逃す可能性がある.
  • 複数の突破の地震で,取引の頻度の問題が生じやすい.
  • 大きく逆転すると,止損が隠される可能性があります.

平均線パラメータを調整し,より効率的な指標判断を使用し,取引頻度を減らすなどの方法など,パラメータ調整によって最適化することができます.また,適応的停止またはフィルター条件の導入などの手段を設定してリスクを制御することもできます.

戦略最適化の方向性

  • EMA,SMA,LWMAなど.
  • フィルタリング条件を追加し,多重な振動取引を避ける.例えば,交付量,ブリンライン,ATRなどの補助判断を導入する.
  • リスクの低減のために,ストップダストストップ戦略を最適化し,テストする.
  • トレンドと逆転などの複数の戦略を組み合わせて,総合的な取引システムを構築する.
  • パラメータ化配置を追加し,戦略を広く適用できるようにしました.

要約する

この戦略は,全体的に比較的シンプルで直感的で,核心構想は平均線を追跡して価格の短期突破を捕捉することである.優点は,反応の敏捷さ,実行の容易さである.欠点は,遅滞性および遅滞性である.後期には,指標選択,止損機構,フィルタリング手段などから最適化され,戦略をより安定的かつ包括的にすることができる.
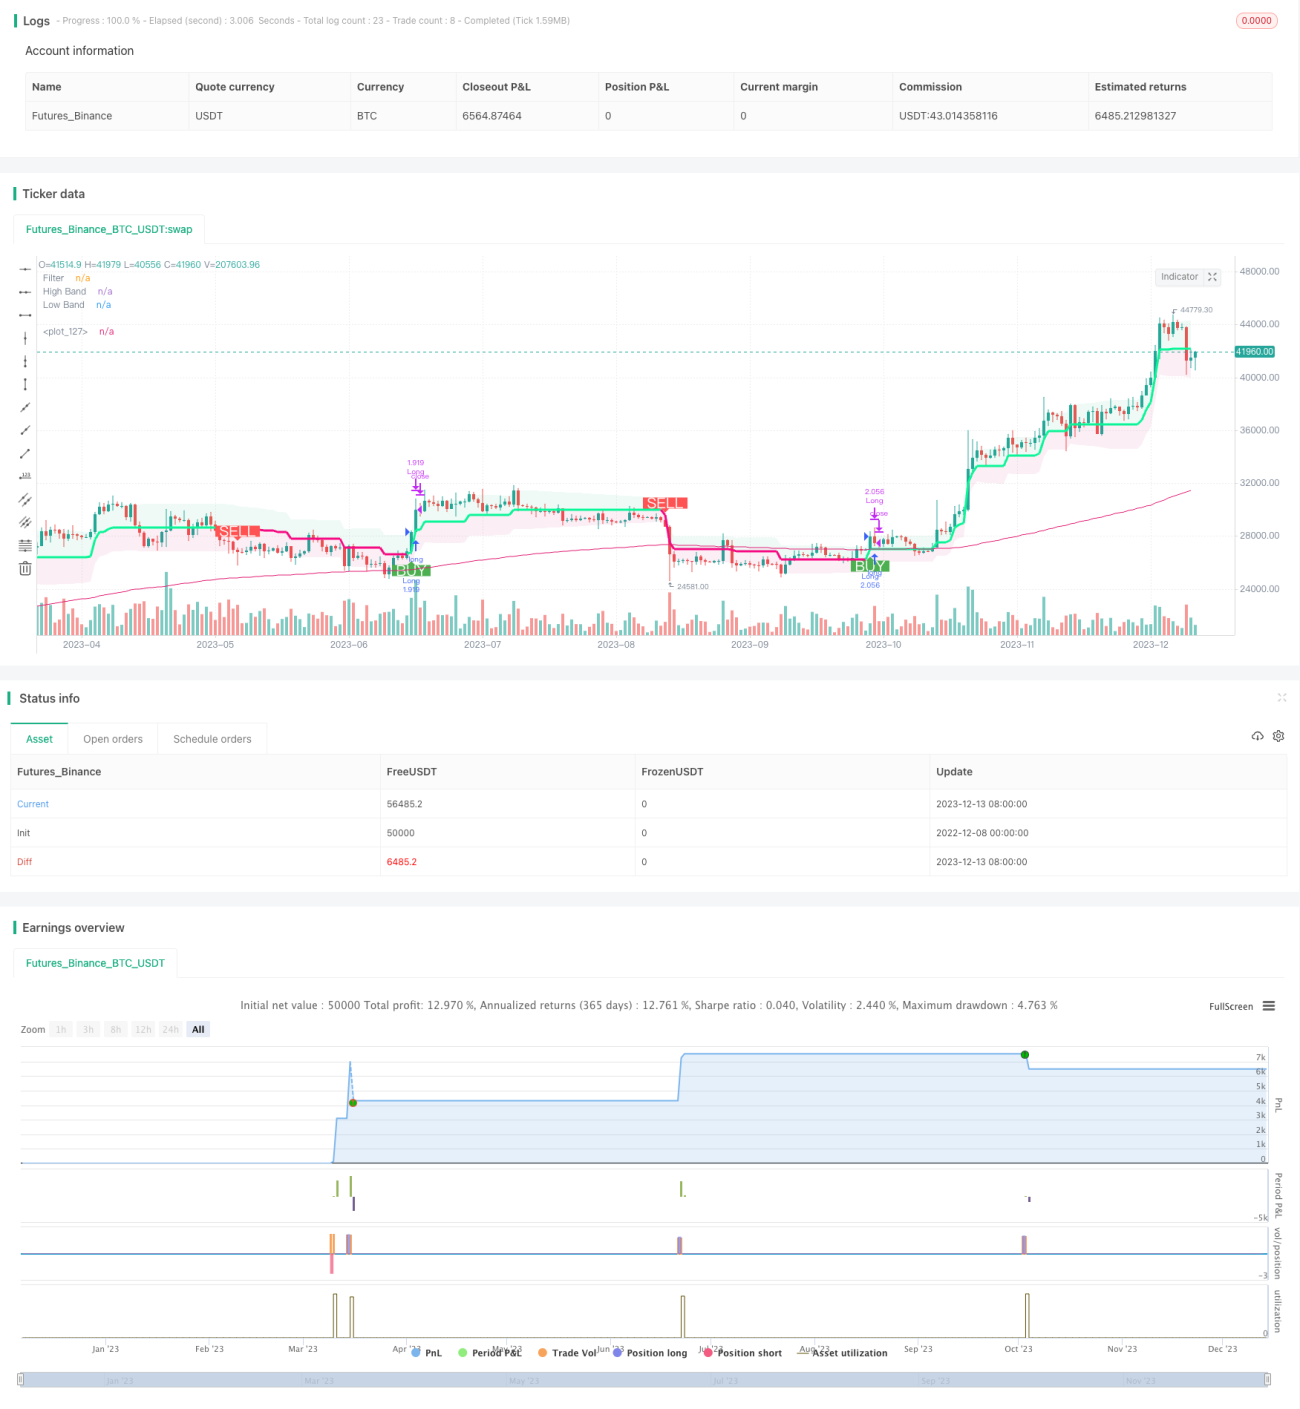
ストラテジーソースコード
/*backtest
start: 2022-12-08 00:00:00
end: 2023-12-14 00:00:00
period: 1d
basePeriod: 1h
exchanges: [{"eid":"Futures_Binance","currency":"BTC_USDT"}]
*/

// This source code is subject to the terms of the Mozilla Public License 2.0 at https://mozilla.org/MPL/2.0/

// Credits to the original Script - Range Filter DonovanWall https://www.tradingview.com/script/lut7sBgG-Range-Filter-DW/
// This version is the old version of the Range Filter with less settings to tinker with

//@version=5
strategy(title='Range Filter - B&S Signals', shorttitle='RF - B&S Signals', initial_capital=1000, currency=currency.GBP, default_qty_value=100, default_qty_type=strategy.percent_of_equity, commission_type=strategy.commission.percent, commission_value=0.075, overlay=true)


i_startTime = input(defval=timestamp('01 Jan 2020 12:00 +0000'), title='Backtest Start')
i_endTime = input(defval=timestamp('01 Jan 2024 12:00 +0000'), title='Backtest End')

inDateRange     = true
//-----------------------------------------------------------------------------------------------------------------------------------------------------------------
//Functions
//-----------------------------------------------------------------------------------------------------------------------------------------------------------------
longLossPerc = input.float(title='Long Stop Loss (%)', minval=0.0, step=0.1, defval=1) * 0.01
shortLossPerc = input.float(title='Short Stop Loss (%)', minval=0.0, step=0.1, defval=1) * 0.01

longTakePerc = input.float(title='Long Take(%)', minval=0.0, step=0.1, defval=1) * 0.01
shortTakePerc = input.float(title='Short Take (%)', minval=0.0, step=0.1, defval=1) * 0.01

emaLength = input.int(200, title="EMA Length")

    // Determine stop loss price

//Range Size Function
rng_size(x, qty, n) =>
//    AC       = Cond_EMA(abs(x - x[1]), 1, n)
    wper = n * 2 - 1
    avrng = ta.ema(math.abs(x - x[1]), n)
    AC = ta.ema(avrng, wper) * qty
    rng_size = AC
    rng_size

//Range Filter Function
rng_filt(x, rng_, n) =>
    r = rng_
    var rfilt = array.new_float(2, x)
    array.set(rfilt, 1, array.get(rfilt, 0))
    if x - r > array.get(rfilt, 1)
        array.set(rfilt, 0, x - r)
    if x + r < array.get(rfilt, 1)
        array.set(rfilt, 0, x + r)
    rng_filt1 = array.get(rfilt, 0)

    hi_band = rng_filt1 + r
    lo_band = rng_filt1 - r
    rng_filt = rng_filt1
    [hi_band, lo_band, rng_filt]

//-----------------------------------------------------------------------------------------------------------------------------------------------------------------
//Inputs
//-----------------------------------------------------------------------------------------------------------------------------------------------------------------

//Range Source
rng_src = input(defval=close, title='Swing Source')

//Range Period
rng_per = input.int(defval=20, minval=1, title='Swing Period')

//Range Size Inputs
rng_qty = input.float(defval=3.5, minval=0.0000001, title='Swing Multiplier')

//Bar Colors
use_barcolor = input(defval=false, title='Bar Colors On/Off')

//-----------------------------------------------------------------------------------------------------------------------------------------------------------------
//Definitions
//-----------------------------------------------------------------------------------------------------------------------------------------------------------------

//Range Filter Values
[h_band, l_band, filt] = rng_filt(rng_src, rng_size(rng_src, rng_qty, rng_per), rng_per)

//Direction Conditions
var fdir = 0.0
fdir := filt > filt[1] ? 1 : filt < filt[1] ? -1 : fdir
upward = fdir == 1 ? 1 : 0
downward = fdir == -1 ? 1 : 0

//Trading Condition
longCond = rng_src > filt and rng_src > rng_src[1] and upward > 0 or rng_src > filt and rng_src < rng_src[1] and upward > 0
shortCond = rng_src < filt and rng_src < rng_src[1] and downward > 0 or rng_src < filt and rng_src > rng_src[1] and downward > 0

CondIni = 0
CondIni := longCond ? 1 : shortCond ? -1 : CondIni[1]
longCondition = longCond and CondIni[1] == -1
shortCondition = shortCond and CondIni[1] == 1

//Colors
filt_color = upward ? #05ff9b : downward ? #ff0583 : #cccccc
bar_color = upward and rng_src > filt ? rng_src > rng_src[1] ? #05ff9b : #00b36b : downward and rng_src < filt ? rng_src < rng_src[1] ? #ff0583 : #b8005d : #cccccc


ema = ta.ema(close,emaLength)

//-----------------------------------------------------------------------------------------------------------------------------------------------------------------
//Outputs
//-----------------------------------------------------------------------------------------------------------------------------------------------------------------
longStopPrice = strategy.position_avg_price * (1 - longLossPerc)
shortStopPrice = strategy.position_avg_price * (1 + shortLossPerc)

longTakePrice = strategy.position_avg_price * (1 + longTakePerc)
shortTakePrice = strategy.position_avg_price * (1 - shortTakePerc)

//Filter Plot
filt_plot = plot(filt, color=filt_color, linewidth=3, title='Filter', transp=67)

//Band Plots
h_band_plot = plot(h_band, color=color.new(#05ff9b, 100), title='High Band')
l_band_plot = plot(l_band, color=color.new(#ff0583, 100), title='Low Band')

//Band Fills
fill(h_band_plot, filt_plot, color=color.new(#00b36b, 92), title='High Band Fill')
fill(l_band_plot, filt_plot, color=color.new(#b8005d, 92), title='Low Band Fill')

//Bar Color
barcolor(use_barcolor ? bar_color : na)

if  inDateRange and close>ema
    strategy.entry("Long", strategy.long, when=longCondition)
    
if   inDateRange and close<ema
    strategy.entry("Short", strategy.short, when=shortCondition)


plot(ema)


//Plot Buy and Sell Labels
plotshape(longCondition, title='Buy Signal', text='BUY', textcolor=color.white, style=shape.labelup, size=size.normal, location=location.belowbar, color=color.new(color.green, 0))
plotshape(shortCondition, title='Sell Signal', text='SELL', textcolor=color.white, style=shape.labeldown, size=size.normal, location=location.abovebar, color=color.new(color.red, 0))

//Alerts
alertcondition(longCondition, title='Buy Alert', message='BUY')
alertcondition(shortCondition, title='Sell Alert', message='SELL')

if strategy.position_size > 0
    strategy.exit(id='Long', stop=longStopPrice, limit=longTakePrice)

if strategy.position_size < 0
    strategy.exit(id='Short', stop=shortStopPrice, limit=shortTakePrice)