ボリンジャーバンドとStochRSI指標に基づく高頻度取引戦略

1
Follow
1779
Followers
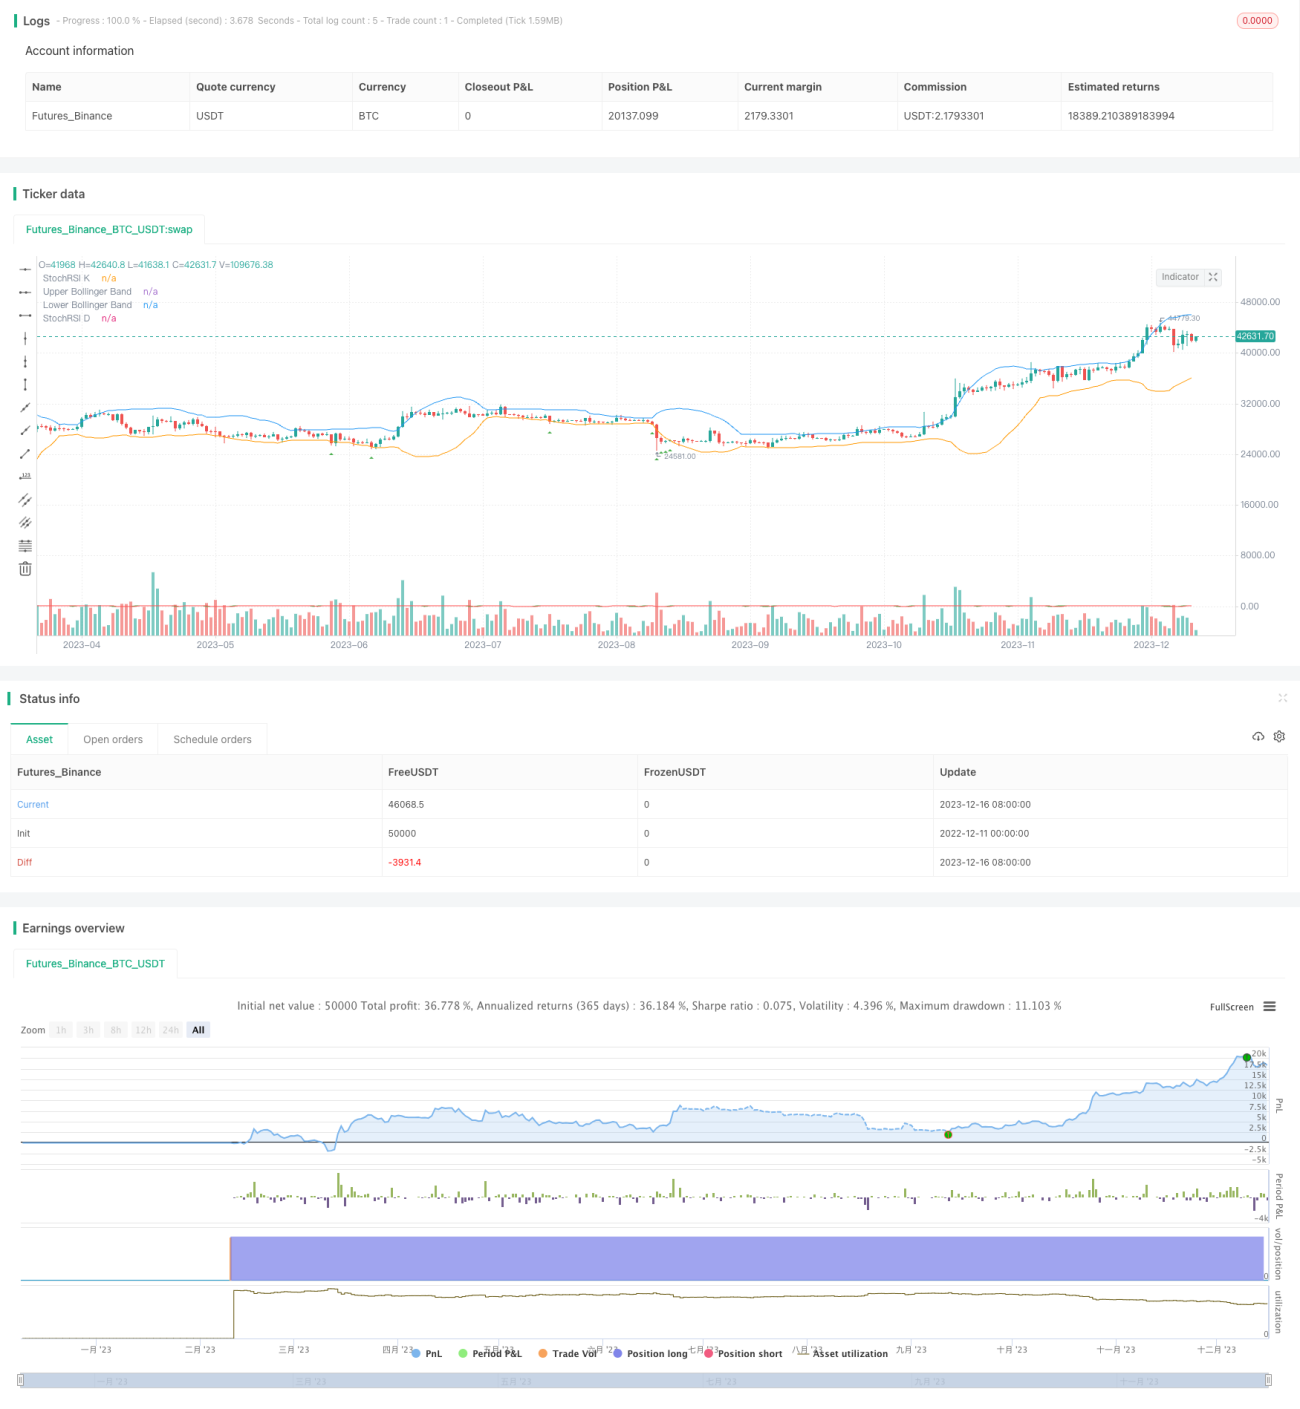
戦略概要
この戦略の名前は<unk>双指数引導戦略<unk>である.これは,単に多めに行う高頻度取引戦略であり,ブリン帯とストキャスティックRSIの2つの指標を介して頻繁な取引シグナルを生成することを目的としている.この戦略は,高頻度取引を追求するトレーダーに適している.
戦略原則
指標計算
まず,ユーザが設定したブリン帯の長さと標準差のパラメータに基づいてブリン帯の上線,中線,下線を計算する.中線は価格の閉じる単純な移動平均を表し,上線と下線は価格の変動の標準差を表す.
次に,ストキャスティックRSIの長さ,Kサイクル,Dサイクルパラメータに基づいて,StochRSIの指数を計算します.この指数は,RSIとランダムな指数の特性を組み合わせて,資産価格の動力を測定します.
購入条件
閉盤価格がブリン帯下落軌道より低いとき,買入条件をトリガーする.このとき,価格が最近の波動範囲の低位にあることを示す潜在的な買入機会である.
入場と退場
購入条件が満たされると,戦略は多頭探機に入り,購入信号を発する.
コードには退出論理が設定されていないため,トレーダー自身が品種と時間枠に応じて利益または損失退出を設定する必要があります.
戦略的優位性
- ブリン帯は,価格が逆転するタイミングを判断します.
- ストックRSIが追加で判断力を発揮する
- 高周波戦略に適した頻度の取引を実現する
- デザインはシンプルです
- 任意のパラメータの優位性
戦略リスク
- 過剰購入の危険性がある
- 高周波取引は,取引コストの影響を受けやすい.
- 利益または損失の退出論理を設定する必要があります.
- 厳しい資金管理が必要です
双方向取引,最適化パラメータ,ストップとストップを設定し,コストヘッジを評価することでリスクを軽減できます.
戦略最適化の方向性
- 販売条件を高め,双方向取引を実現
- オプティマイズ パラメータ 組み合わせ 誤信号を減らす
- トレンド判定指標のフィルターを追加
- ストップ・ストップを設定し,リスクを管理する
要約する
この戦略は,ブリン帯とストックRSIの指標に基づく高周波取引戦略の枠組みを提供します.トレーダーは,自身の取引目標と市場条件,パラメータ設定の調整,リスク管理措置の追加などに応じて,この戦略を最適化して,頻繁に取引するニーズを実現することができます.
Source
Pine
//@version=5
strategy("High Frequency Strategy", overlay=true)

// Define your Bollinger Bands parameters
bollinger_length = input.int(20, title="Bollinger Bands Length")
bollinger_dev = input.float(2, title="Bollinger Bands Deviation")

// Calculate Bollinger Bands
sma = ta.sma(close, bollinger_length)
dev = bollinger_dev * ta.stdev(close, bollinger_length)

upper_band = sma + devStrategy parameters
Related strategies
Comment
All comments (0)
No data
- 1