低ボラティリティの方向性買いストップ利益とストップ損失戦略

1
Follow
1779
Followers
概要
この策略は,低波動方向の買入ストップ・損失策略と呼ばれています.これは,移動平均の交差を買入信号として使用し,ストップ・損失と組み合わせて利益をロックし,低波動区間の通貨に適用されます.
戦略原則
この戦略は3つの異なる周期の移動平均を使用します:50周期,100周期,200周期. 購入の論理は,50周期ラインが100周期ラインを横切ると,そして100周期ラインが200周期ラインを横切ると,追加入場を行います.
この信号は,市場が低波動区間から突破し,トレンド状態に入ろうとしていることを示している.50周期の急速な上昇は,短期間の内部力の突然の強化を意味し,中長線を上方へ駆動し始めていることを示している.100周期の線も,中期的な力の加入を意味し,安定した上向きの動きを示している.
入場後,ストップ・ストップ・ロスの方法で利潤をロックする戦略. ストップ・ストップ・目標は入場価格の8%,ストップ・ロスのラインは入場価格の4%である. ストップ・ストップをストップよりも大きく設定し,損失を上回る利得を有利に設定し,戦略の全体的な収益性を確保する.
優位分析
この戦略の利点は以下の通りです.
- 低波動区間の突破によってもたらされるトレンドの機会を正確に捉えることができます.
- 移動平均は簡単に計算し,反省し,論理はシンプルで明確である.
- ストップ・ストップ・ロスの設定は合理的で,安定した利益を得るのに有利である.
- 設定可能なパラメータは柔軟で簡単に最適化できます.
リスク分析
この戦略にはいくつかのリスクがあります.
- 誤った突破信号は損失を招く可能性があります.
- 市場が逆転すると 損をするのは難しい.
- ストップ・ロスのパラメータを誤って設定すると,利益に影響する.
対策として
- 他の指標と組み合わせたフィルタリング信号は,突破の有効性を保証する.
- 停止損失周期を適切に短縮し,逆転による損失を減らす.
- 異なるストップ・ストップダスト比率をテストし,最適なパラメータを探します.
最適化の方向
この戦略は以下の点で最適化できます.
- 異なる移動平均周期パラメータをテストし,最適な組み合わせを見つける.
- トレンドブレイクを確認するために取引量などの指標を追加する.
- ストップ・ストップ・損失幅を動的に調整する.
- 突破率を予測する機械学習などの手法
- 異なる市場条件や通貨に合わせてパラメータを調整する.
概要として,この戦略は,全体的な運行論理が明確であり,移動平均周期とストップ・ストップ・損失幅を配置することで,低リスクの利益を得ることができ,量化取引に柔軟に適用できます.その後,入場信号,ストップ・損失方法などから最適化することができ,パラメータ調整に合わせて最適な効果を探します.
Source
Pine
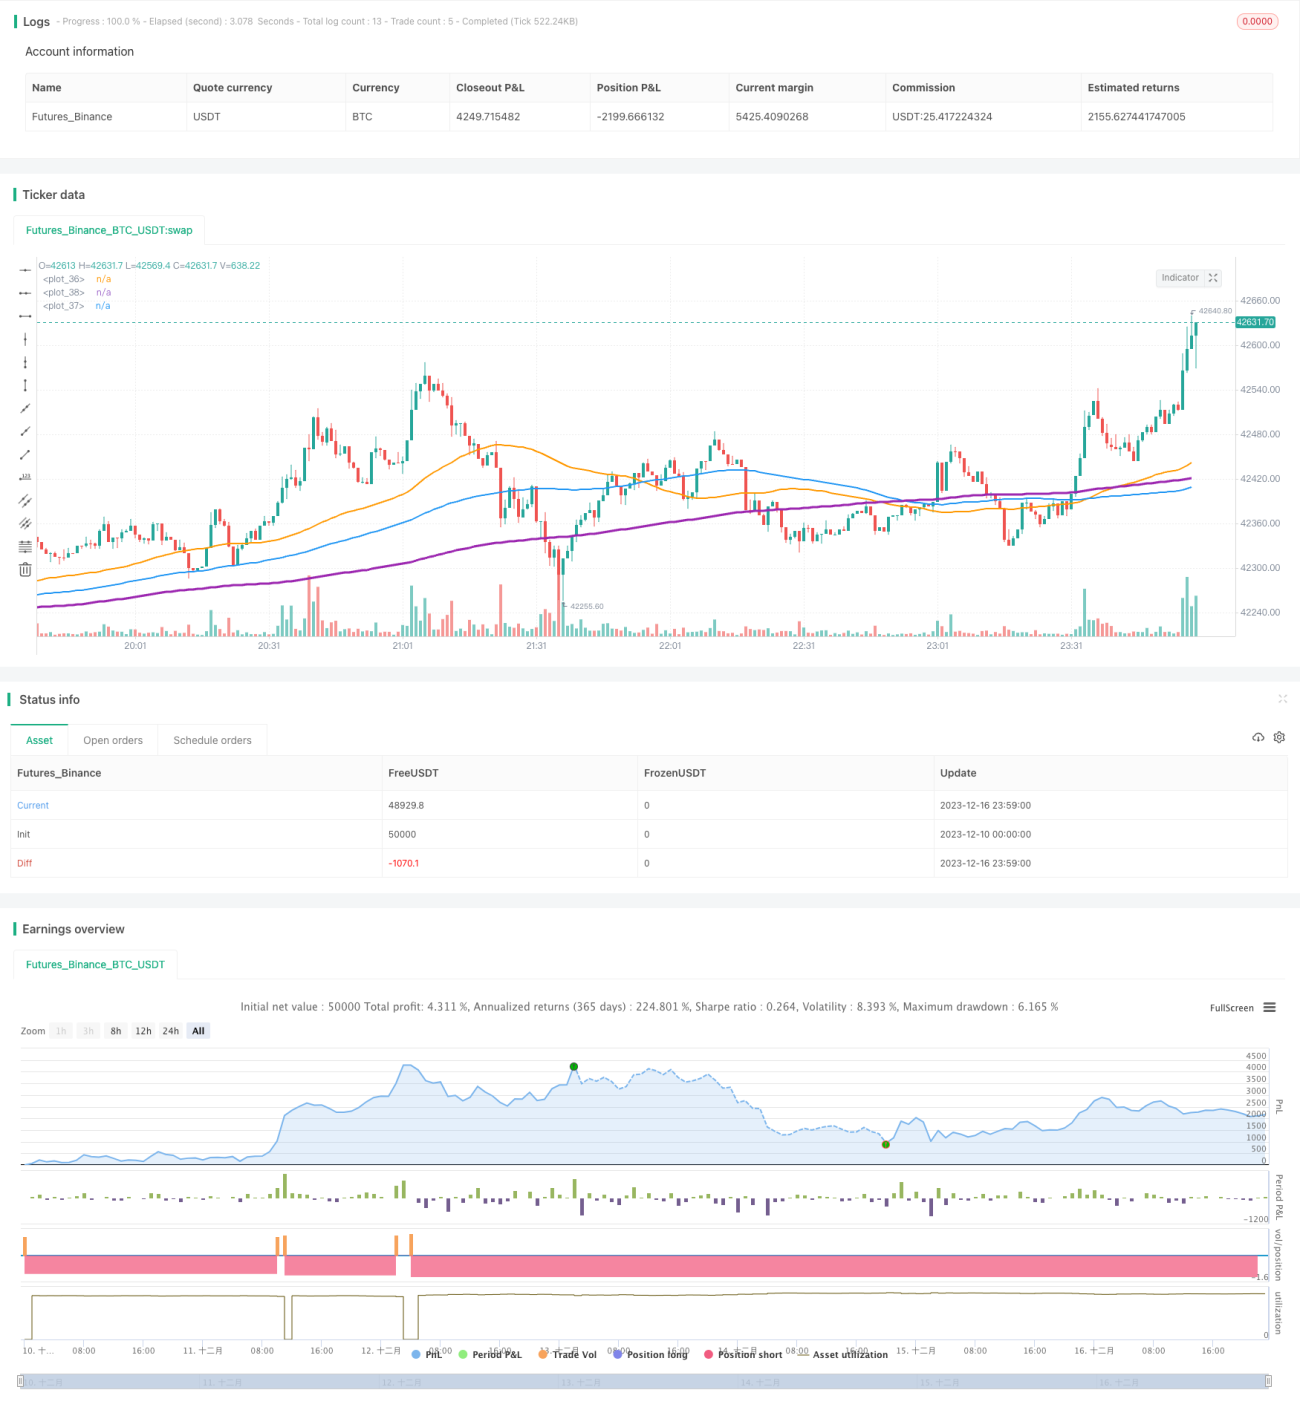
/*backtest
start: 2023-12-10 00:00:00
end: 2023-12-17 00:00:00
period: 1m
basePeriod: 1m
exchanges: [{"eid":"Futures_Binance","currency":"BTC_USDT"}]
*/

//@version=4
strategy(shorttitle='Low volatility Buy w/ TP & SL (by Coinrule)',title='Low volatility Buy w/ TP & SL', overlay=true, initial_capital = 1000, process_orders_on_close=true, default_qty_type = strategy.percent_of_equity, default_qty_value = 100)

//Backtest datesStrategy parameters
Related strategies
Comment
All comments (0)
No data
- 1