ガリレオ移動平均クロスオーバー戦略

概要
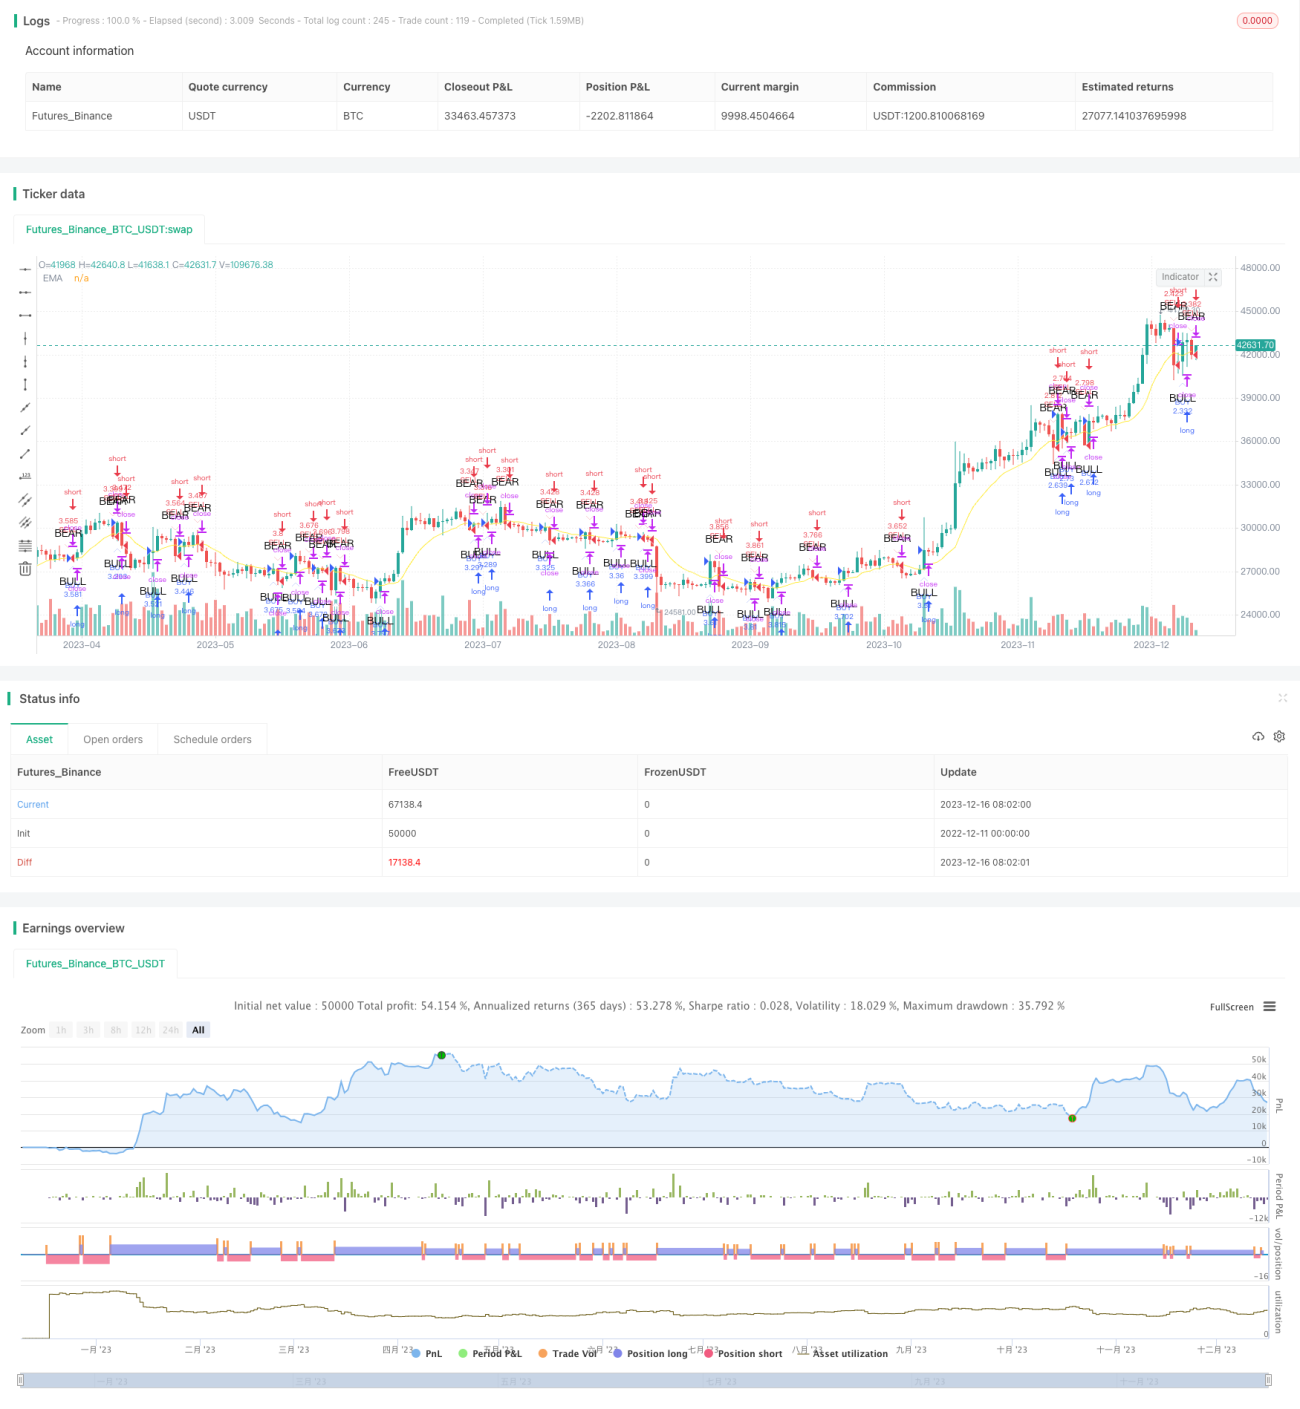
<unk>利略平均線交差策 (Galileo's line-crossing strategy) は,移動平均線に基づく取引策である.この策は,一定の周期の指数移動平均を計算し,価格と交差比較することで取引シグナルを生成する.価格が上方から下方へと平均線を破るとき,売りシグナルを生成する.価格が下方から平均線を破るとき,買いシグナルを生成する.この策の名前は,<unk>利略・<unk>利略に由来する.
戦略原則
ガリレオ平均線交差策の核心は指数移動平均 (EMA) である.EMAは,最近の価格により大きな重みを与える傾向にある移動平均アルゴリズムである.その計算式は次のとおりである.
EMA 今日 = (今日閉店価格×平滑常数) + (昨日EMA×−平滑常数))
その中,平滑常数α=(2/(周期数+1)) 。
この戦略は,ユーザの入力された周期長から,リアルタイムでEMA値を計算する. そして,価格とEMAを比較し,両者の交差を判断し,買入と売却の信号として:
-
価格が上から下へと落ちてEMAを下回ったとき,セールシグナルを生じ,ショートライン操作を行う.
-
価格が下方からEMAを突破すると,買取シグナルが生み出され,多操作が行われます.
この戦略は,EMA線と,買入シグナルを示す矢印を同時に描きます.
優位分析
ガリレオの均線交差策には以下の利点がある.
- シンプルで,理解しやすく,初心者にも適しています.
- EMAを使用することで,価格の変化により迅速に反応できます.
- 交差点の信号は明快で,取引は頻繁に起こらない.
- EMAのパラメータを調整することで,異なる市場環境に対応できます.
- 危険を制御する 入り出口の信号を明確にする
リスク分析
ガリレオの均線交差策には以下のリスクがあります.
- 価格が激しく波動する時には,偽信号が多く現れ,効果に影響する. ストップ・ロスの戦略を設定して最適化することができる.
- 単一の指標は,偽りの行為の影響を受けやすく,信号が失敗する. 追加の指標を追加して最適化することができる.
- ある程度の遅延がある,特に突発事件の発生後に. 短縮平均線パラメータをテストすることができる.
- 長期にわたる価格の一方的な動きに適応できない.これは均一線策の共通な欠点である.
最適化の方向
ガリレオの均線交差策は以下の方向から最適化できる.
-
他の指標と組み合わせて,複合戦略を構築し,偽信号を回避し,安定性を高めます.例えば,取引量,トレンド指標などを追加します.
-
ストップ・ロスを追加し,移動ストップまたはパーセンテージ・ストップを設定し,単一損失を制御する.
-
EMAの異なるパラメータの効果をテストし,最適なパラメータの組み合わせを選択します. 他のタイプの移動平均もテストできます.
-
価格の逆転に伴う再入場を評価し,<unk>利率を向上させる.
要約する
ガリレオの均線交差戦略は,シンプルで実用的な取引戦略で,考え方が明確で,操作が簡単で,量化取引の初心者向けである.継続的な最適化と改善とともに,その効果がますます良くなるだろうと信じられ,推奨される.
- 1