モメンタムTDリバーサル取引戦略

1
Follow
1779
Followers
概要
動量TD反転取引戦略は,TD Sequential指標を使用して価格反転信号を識別する量化取引戦略である.この戦略は,価格動量分析に基づいて,価格反転信号が確認された後に多額のまたは空白のポジションを確立する.
戦略原則
この戦略は,TD Sequential指標を使用して価格の変動を分析し,9つの連続したK線の価格逆転の形状を識別する.具体的には,K線の上昇が9つの連続したK線の価格上昇に続くと,K線の低下が起こるのを認識すると,戦略は空調の機会として判断する.逆に,K線の上昇が9つの連続したK線の価格低下に続くと,戦略は多額の機会として判断する.
TDシーケンシャル指標の優位性を利用して,価格逆転シグナルを早期に捉えることができる.この戦略に含まれる一定数の追尾殺跌の仕組みと組み合わせて,逆転シグナルが確認された後に,時間内に多額のまたは空白のポジションを確立することができ,その結果,価格逆転の開始段階でより良い入場機会を得ることができる.
優位分析
- TDシーケンス指数は,価格の逆転の可能性を予測する.
- 価格の逆転を早期に判断するための追尾メカニズムの構築
- 逆転形成段階でポジションを確立し,入場ポイントを優遇する.
リスク分析
- TDシーケンス指数では,偽突破が発生し,他の要因と組み合わせて確認する必要がある.
- ポジションの規模と時間を適切に管理し,リスクを低減する必要があります.
最適化の方向
- 逆転信号を他の指標と組み合わせて決定し,偽突破のリスクを避ける
- 単一損失を抑えるための ストップ・パーズ・メカニズム
- ポジションの規模と保持時間を最適化し,利益の規模とリスク管理をバランスさせる
要約する
動量TD反転取引戦略は,TDシーケンシャル指標によって価格反転を事前に判断し,反転が確認された後に迅速にポジションを確立する,動量トレーダーの使用に適した戦略である.この戦略は,反転の機会を識別する利点があるが,偽の突破により大きな損失を避けるためにリスクを制御することに注意する必要がある.さらに最適化することで,リスクと利益のバランスの取れた取引戦略である.
Source
Pine
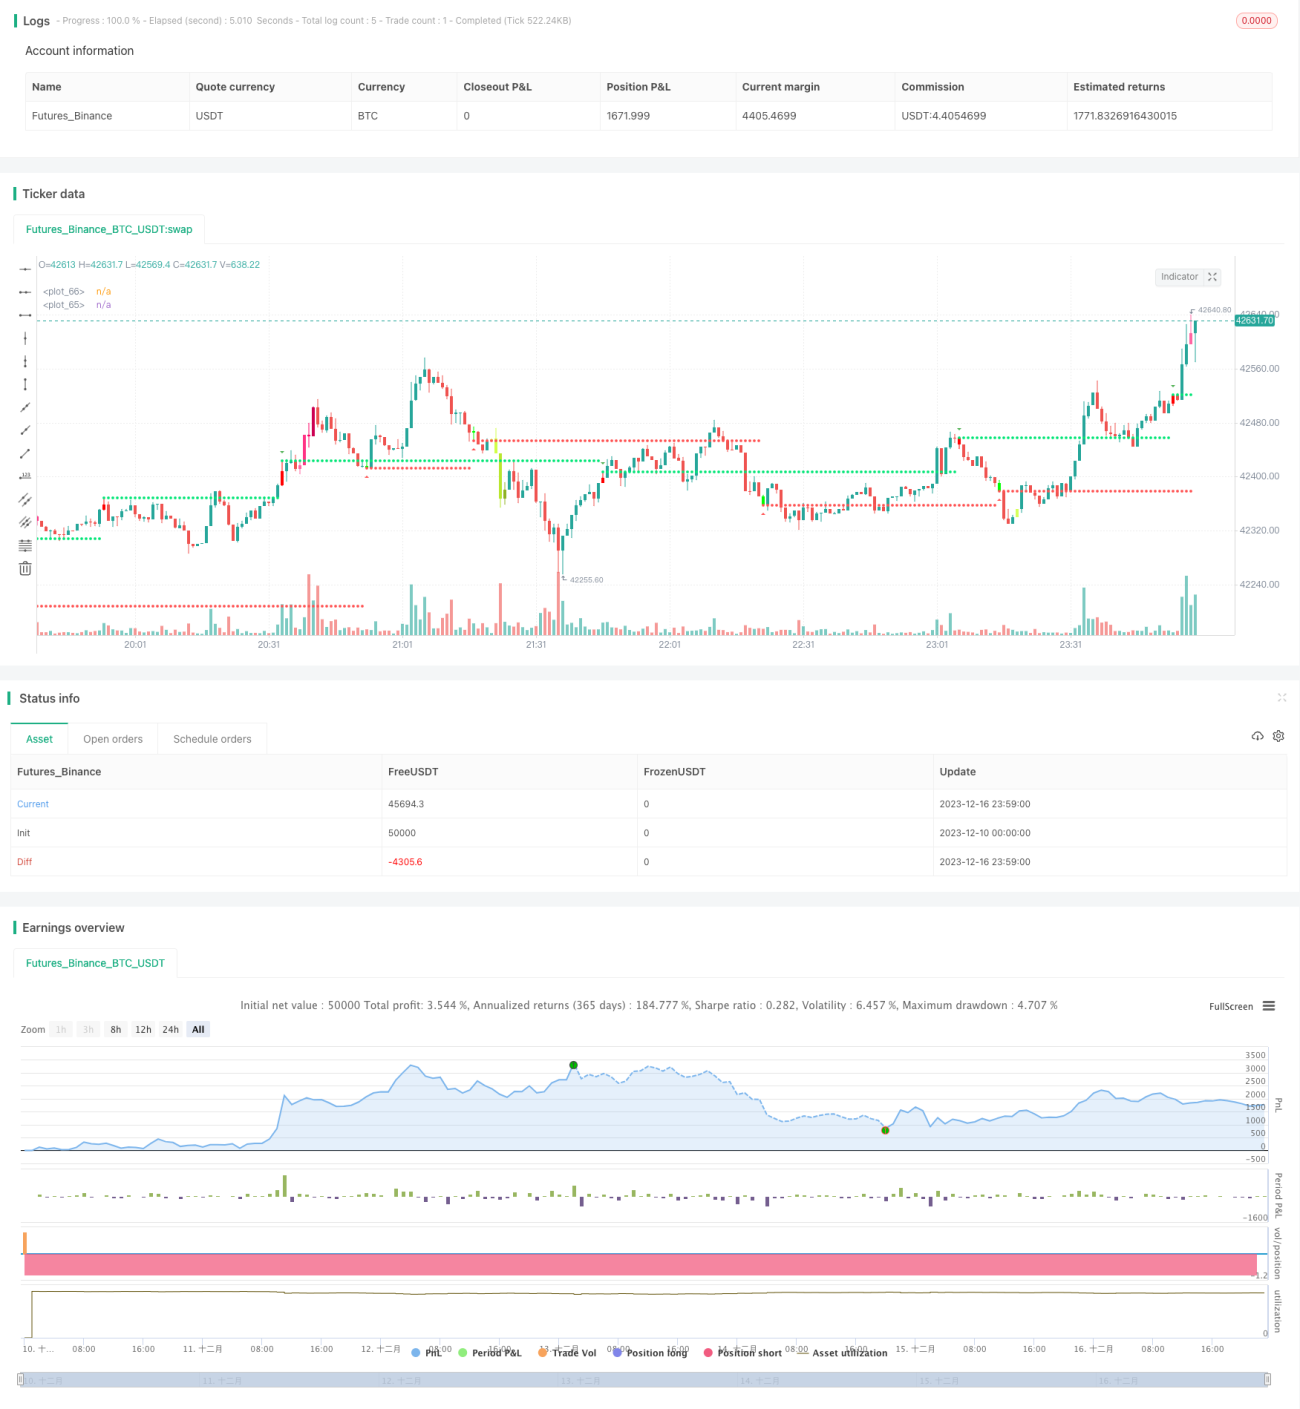
/*backtest
start: 2023-12-10 00:00:00
end: 2023-12-17 00:00:00
period: 1m
basePeriod: 1m
exchanges: [{"eid":"Futures_Binance","currency":"BTC_USDT"}]
*/

//@version=4
//This strategy is based on TD sequential study from glaz.
//I made some improvement and modification to comply with pine script version 4.
//Basically, it is a strategy based on proce action, supports and resistance.Strategy parameters
Related strategies
Comment
All comments (0)
No data
- 1