モメンタムブレイクアウト移動平均取引戦略


作成日: 2023-12-18 18:01:59 最終変更日: 2023-12-18 18:01:59
コピー: 0 クリック数: 630
1
フォロー
1621
フォロワー

モメンタムブレイクアウト移動平均取引戦略

概要

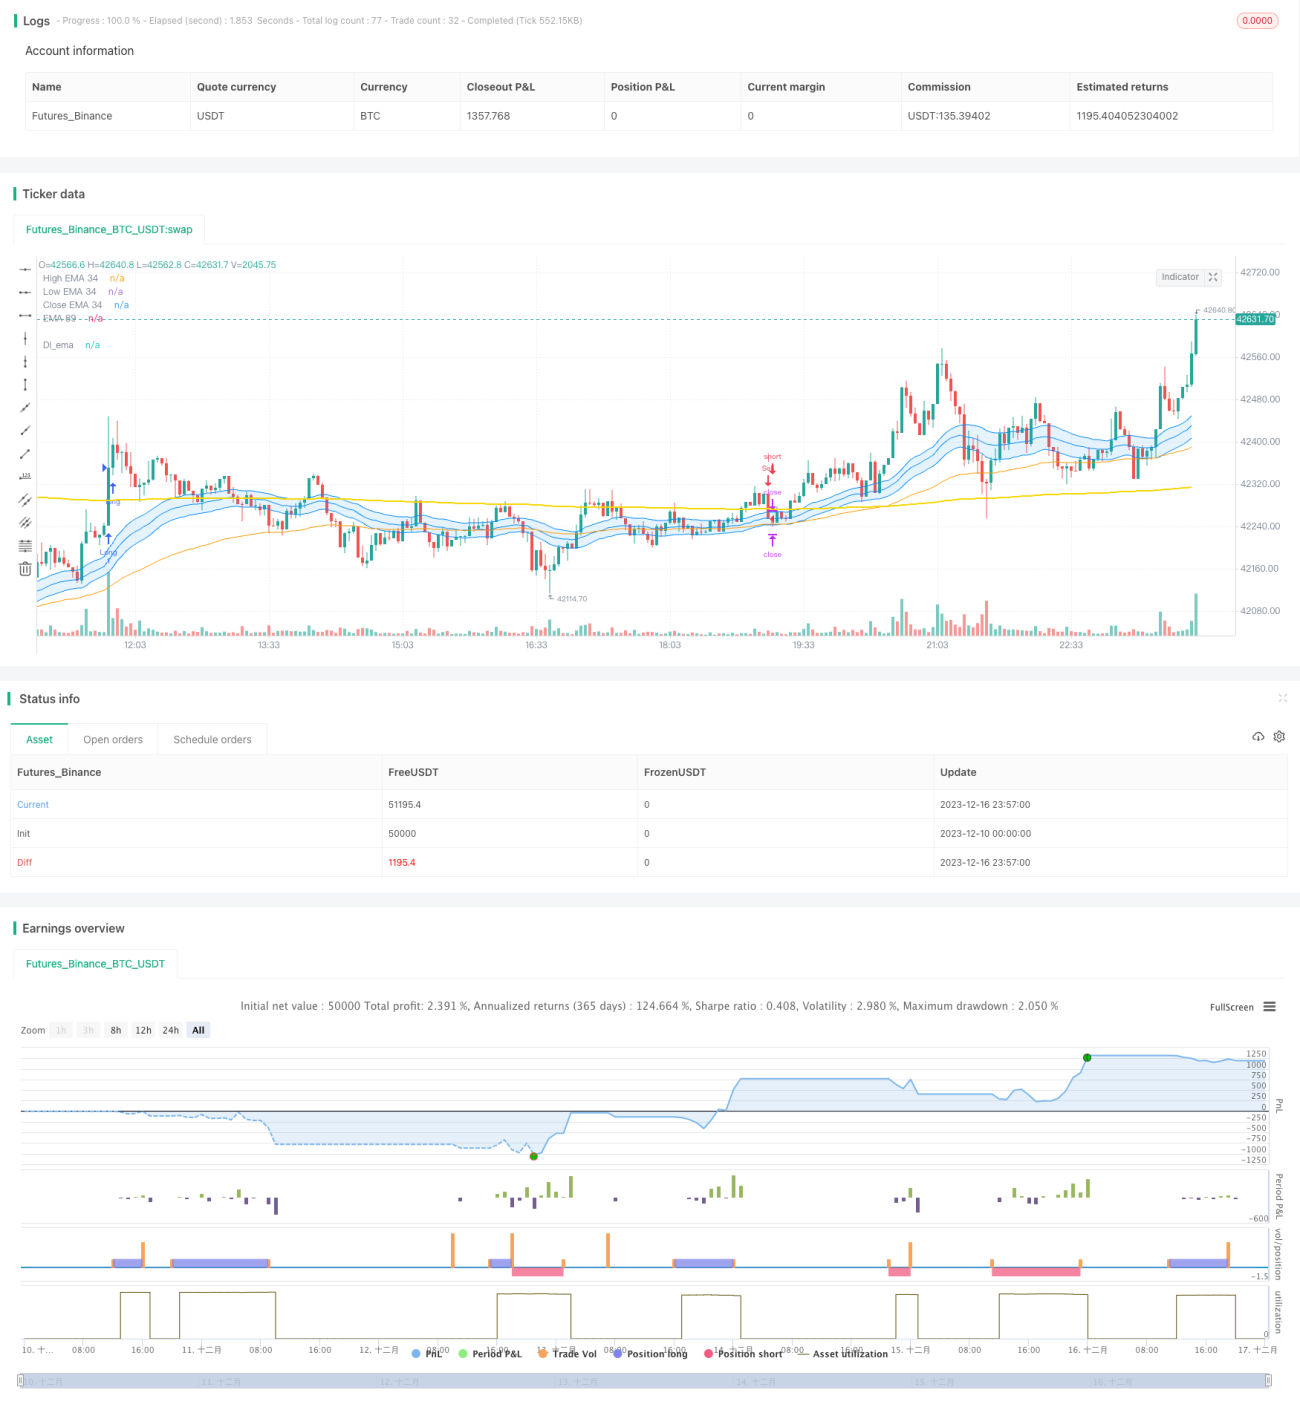
この戦略は,動量指標と平均線指標を組み合わせたトレンド追跡戦略である.これは,指数移動平均を主要トレンド判断ツールとして使用し,高額取引量と組み合わせて,買入と売却のシグナルを発信する.この戦略は,市場の主なトレンドを追跡する中長線ポジションに適用される.

戦略原則

  1. 34周期のEMAを主要トレンド判断ツールとして使用する.価格がEMAを突破する時は看板信号,EMAを突破する時は下落信号である.

  2. 取引量の21日移動平均を最近の平均の1.5倍と比較する. 現在の取引量が平均の1.5倍以上である場合は,高いと考えられる.

  3. 価格とEMAが金叉を形成し,高量である場合にのみ,買入シグナルを発信する. 価格とEMAが死叉を形成し,高量である場合にのみ,売出シグナルを発信する.

  4. ポジション開設後,ストップ・ロズとストップ・ストップの比率を設定し,カスタマイズすることができます.

傾向,動力,リスク管理などの様々な要因を総合的に考慮し,比較して包括的で安定したものです.

優位分析

  1. EMAを使って市場の主要トレンドの方向を判断し,中長線トレンドを効果的に追跡することができる.

  2. FILTERは,高取引量と組み合わせて,偽の突破を誤導されるのを防ぐことができます.

  3. ストップ・ロース・ストップ・スロープの比率を設定することで,単一取引のリスクを効果的にコントロールできます.

  4. 中長線保有策を採用し,高周波市場の騒音の影響を受けず,安定的に保有する.

リスクと解決策

  1. 高周波偽突破によって誤導される可能性が高い. 解決方法は取引量検証の追加である.

  2. 中長線はポジションを保有し,資金占有を増加させる. 解決方法は,ポジションの規模を適切に制御することである.

  3. 均線取引戦略は遅滞し,ショートラインの機会を掴むことができません. 解決策は,他のショートライン信号と組み合わせることです.

  4. 大規模な震動の場合,大きな損失が発生する可能性があります. 解決策は,適切な止損位置を設定することです.

最適化の方向

  1. 異なるEMA周期パラメータの優劣をテストし,最適なパラメータを見つけます.

  2. 異なるストップ・ストップ・スロープ比率のパラメータが,戦略の収益率とリスク抵抗力の影響をテストする.

  3. MACD,KDJなどの他の指標と組み合わせて,ショートラインの機会を判断してみてください.

  4. ポジション管理,ダイナミック・ストップ・ローズなどの資金管理戦略を最適化する方法

要約する

この戦略は,全体として,価値が安定する中長線保有戦略である.これは,市場の主要トレンドを効果的に追跡することができ,誤導信号をフィルターするために量能指標を使用することができる.同時に,適切な止損と停止手段を導入し,単一取引のリスクを制御することができる.これは,トレンド取引の定盤を淡々と清掃する行為である.適切な最適化を行えば,より理想的な戦略の収益率を得ることができると信じています.

ストラテジーソースコード
/*backtest
start: 2023-12-10 00:00:00
end: 2023-12-17 00:00:00
period: 3m
basePeriod: 1m
exchanges: [{"eid":"Futures_Binance","currency":"BTC_USDT"}]
*/

// This source code is subject to the terms of the Mozilla Public License 2.0 at https://mozilla.org/MPL/2.0/
// © TradingSignalHub

//@version=5
strategy("Di strategy ", overlay=true)

//date setting
fromDay = input(defval = 1, title = "Ngày bắt đầu", group = "Cài đặt thời gian")
fromMonth = input(defval = 1, title = "Tháng bắt đầu", group = "Cài đặt thời gian")
fromYear = input(defval = 2023, title = "Năm bắt đầu", group = "Cài đặt thời gian")

toDay = input(defval = 31, title = "Đến ngày", group = "Cài đặt thời gian")
toMonth = input(defval = 12, title = "Đến tháng", group = "Cài đặt thời gian")
toYear = input(defval = 2033, title = "Đến năm", group = "Cài đặt thời gian")

startDate = timestamp(fromYear, fromMonth, fromDay, 00, 00)
finishDate = timestamp(toYear, toMonth, toDay, 00, 00)
time_cond() => 
    time >= startDate and time <= finishDate ? true : false

//snr setting
price = close
ema34     = input.int(34, minval=2, title="EMA 34", group = "Cài đặt EMA")
pacC        = ta.ema(close,ema34)
pacL        = ta.ema(low,ema34)
pacH        = ta.ema(high,ema34)
L =plot(pacL, color=color.rgb(3, 139, 251), linewidth=1, title="High EMA 34")
H =plot(pacH, color=color.rgb(3, 137, 247), linewidth=1, title="Low EMA 34")
C =plot(pacC, color=color.rgb(4, 138, 248), linewidth=1, title="Close EMA 34")
fill(L,H, color=color.rgb(33, 149, 243, 85),title="Fill dãi EMA 34")

//EMA full setting
ema89 =ta.ema(close,89)
DIema= ta.ema(close,458)
plot(DIema,title="DI_ema",color=color.rgb(247, 214, 3),linewidth=2)
plot(ema89,title="EMA 89",color=color.orange,linewidth=1)
//ema200= ta.ema(close,200)
//ema610= ta.ema(close,610)
//ema144= ta.ema(close,144)
//ema258= ta.ema(close,258)
//plot(ema200,title="EMA 200",color=color.purple,linewidth=2)
//plot(ema610,title="EMA 610",color=color.white,linewidth=2)
//plot(ema144,title="144Banker",color=color.green,linewidth=1)
//plot(ema258,title="258Banker",color=color.yellow,linewidth=1)

EMAbuy = ta.crossover(price, DIema)
EMAsell = ta.crossunder(price, DIema)

//volume setting
vol = (volume)
length = input(21, "Đường Trung Bình Vol", group = "Cài đặt Volume" )
div = input(1.5, "Mức trung bình", group = "Cài đặt Volume" )
up = close > open 
down = open>close
Volhigh = volume> (ta.ema(volume, length)*div)

//Cài đặt lệnh
longCondition = EMAbuy and Volhigh
if time_cond()
    if (longCondition)
        strategy.entry("Long", strategy.long)

shortCondition = EMAsell and Volhigh
if time_cond()
    if (shortCondition)
        strategy.entry("Sell", strategy.short)


stopPer = input.float(1.0, title="Stop Loss %", group = "Cài đặt TP & SL %" ) / 100
takePer = input.float(2.0, title="Take Profit %", group = "Cài đặt TP & SL %" ) / 100

// Determine where you've entered and in what direction
longStop = strategy.position_avg_price * (1 - stopPer)
shortStop = strategy.position_avg_price * (1 + stopPer)
shortTake = strategy.position_avg_price * (1 - takePer)
longTake = strategy.position_avg_price * (1 + takePer)

if strategy.position_size > 0 
    strategy.exit(id="Đóng Long", stop=longStop, limit=longTake)
if strategy.position_size < 0 
    strategy.exit(id="Đóng Sell", stop=shortStop, limit=shortTake)

alertcondition(longCondition, title = "Tín hiệu BUY", message = "Tín hiệu BUY")
alertcondition(shortCondition, title = "Tín hiệu SELL", message = "Tín hiệu SELL")
//PLOT FIXED SLTP LINE
//plotshape(strategy.position_size > 0 ? longStop : na, shape.labelup, color=color.rgb(34, 249, 6, 50), linewidth=1, title="Long SL")
//plot(strategy.position_size < 0 ? shortStop : na, style=plot.style_circles, color=color.rgb(250, 8, 8, 50), linewidth=1, title="Short SL")
//plot(strategy.position_size > 0 ? longTake : na, style=plot.style_linebr, color=color.rgb(59, 248, 7), linewidth=1, title="Long TP")
//plot(strategy.position_size < 0 ? shortTake : na, style=plot.style_linebr, color=color.rgb(247, 7, 7), linewidth=1, title="Short TP")