スーパートレンドフォローストップロス戦略

概要
この戦略は超トレンド指標と追跡ストップに基づいてポジションを開き,平和ポジションを開きます.この戦略は4つのアラームを使用して,平和ポジションを開き,超トレンド戦略を採用します.この戦略は,特にロボットの設計のために,追跡ストップ機能を持っています.
戦略原則
この戦略はATR指標を使用して上軌道と下軌道を計算する. 閉盤価格が上軌道を破るときに買取シグナルを生じ,下軌道を破るときに売り出しシグナルを生じする. この戦略は,超トレンドラインを使用し,トレンドの方向を判断する. 超トレンドラインに突破すると,牛市が始まることを示し,超トレンドラインに突破すると,熊市が始まることを示します.
優位分析
この戦略は,超トレンド指標がトレンドの方向を判断し,ATR指標がストップを設定する優位性を組み合わせて,偽突破を効果的にフィルターできます.ストップを追跡することで,利潤をうまくロックし,撤回を減らすことができます.さらに,この戦略は,ロボットに専ら設計され,取引を自動化することができます.
リスク分析
超トレンド指標は誤信号を多く発生させやすい.止損価格の調整幅が大きい場合,止損が打ち破られる確率は高くなります.また,ロボット取引は,サーバーの停止,ネットワークの停止などの技術的リスクにも直面しています.
誤信号の可能性を減らすために,ATRパラメータを適切に調整したり,他の指標を追加してフィルタリングを行うことができます.止損追跡幅を調整する際には,利益とリスクをバランスする必要があります.また,技術的な障害のリスクを防ぐためにバックアップサーバーとネットワークを準備してください.
最適化の方向
この戦略は以下の点で最適化できます.
-
入場信号をフィルタリングするために指標または条件を追加し,誤信号を回避します.例えばMACD指標を追加できます.
-
異なるATRパラメータの組み合わせをテストして,最適なパラメータを見つけることができます.
-
ストップダストトラッキングの幅を最適化して,最適なバランスポイントを見つけることができます.
-
複数のストップ・プライスを追加して,分割ストップを実現できます.
-
メイン・バックアップ・デュアル・サーバー・アーキテクチャを確立し,メイン・サーバーの故障時に迅速に切り替えることができる.
要約する
この戦略は,超トレンド指標とストップを追跡する優位性を統合し,ポジション開設とストップを自動化することができます.実体内の最適化方向の改善策を組み合わせて,非常に実用的な量化取引戦略になることができます.
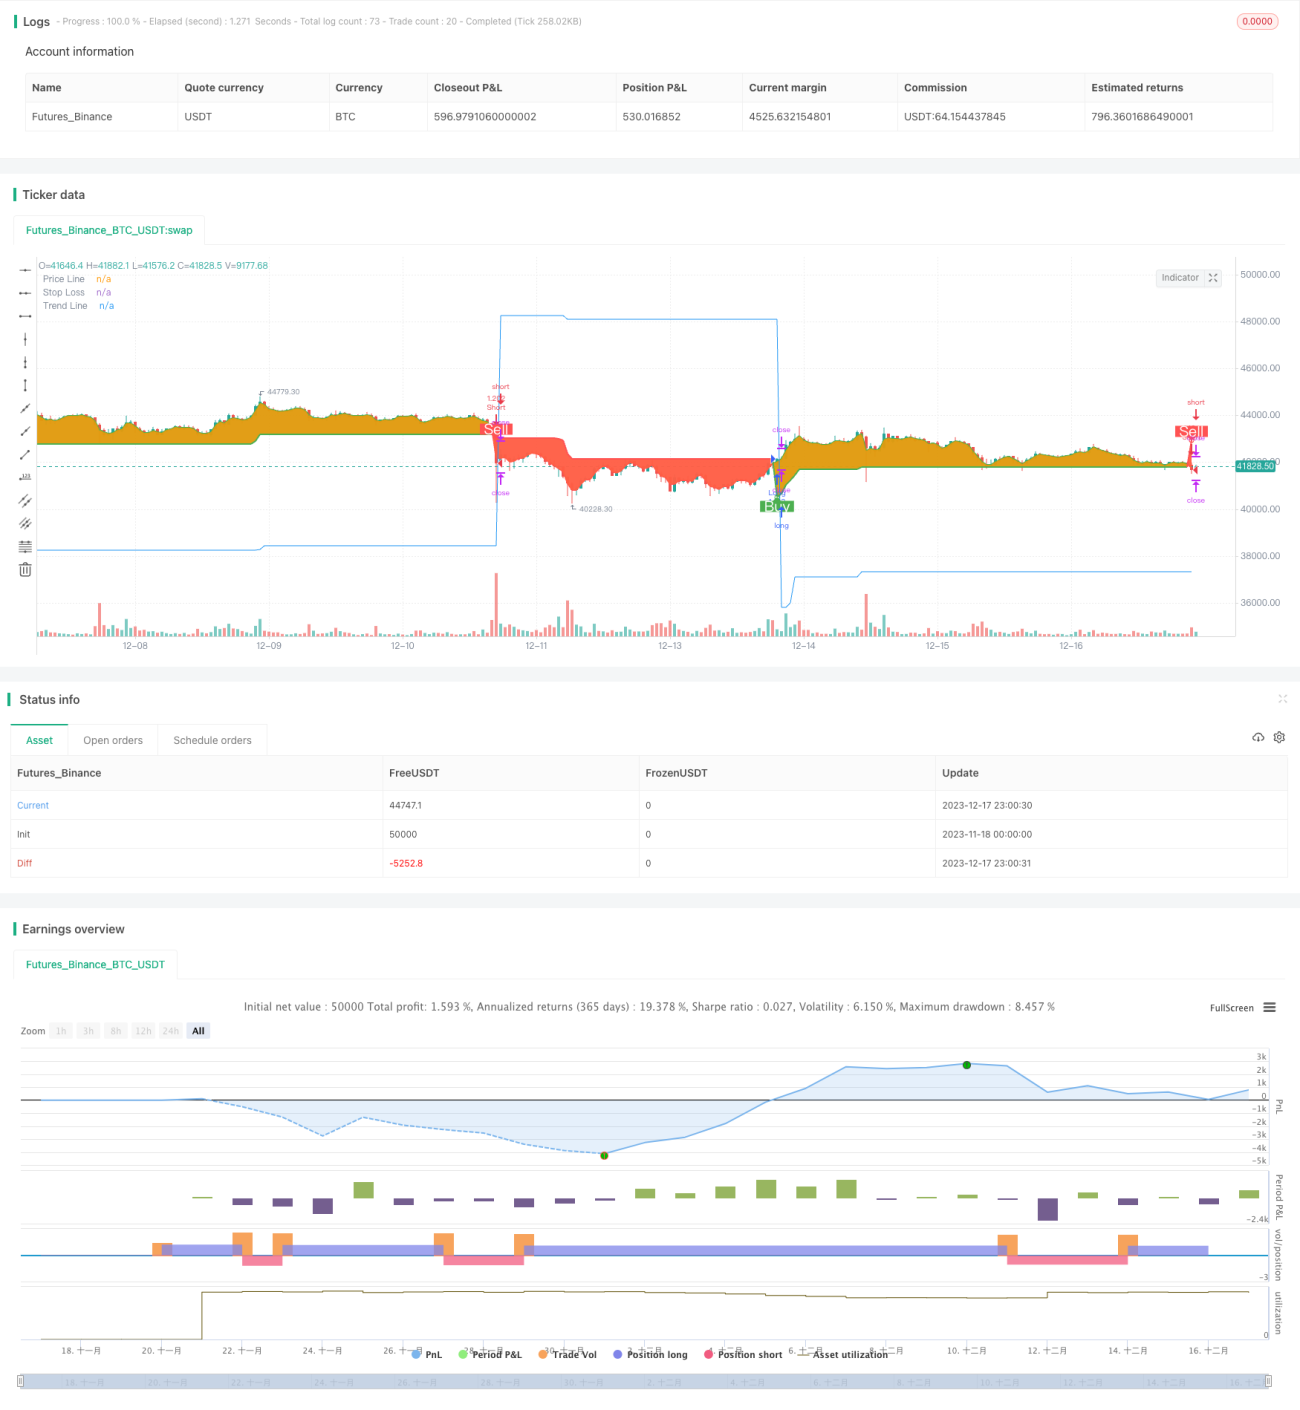
/*backtest
start: 2023-11-18 00:00:00
end: 2023-12-18 00:00:00
period: 1h
basePeriod: 15m
exchanges: [{"eid":"Futures_Binance","currency":"BTC_USDT"}]
*/

// This source code is subject to the terms of the Mozilla Public License 2.0 at https://mozilla.org/MPL/2.0/
// © arminomid1375
//@version=5
strategy('Mizar_BOT_super trend', overlay=true, default_qty_value=100, currency=currency.USD, default_qty_type=strategy.percent_of_equity, initial_capital=100, max_bars_back=4000)- 1