一目均衡表に基づくBTC取引戦略

概要
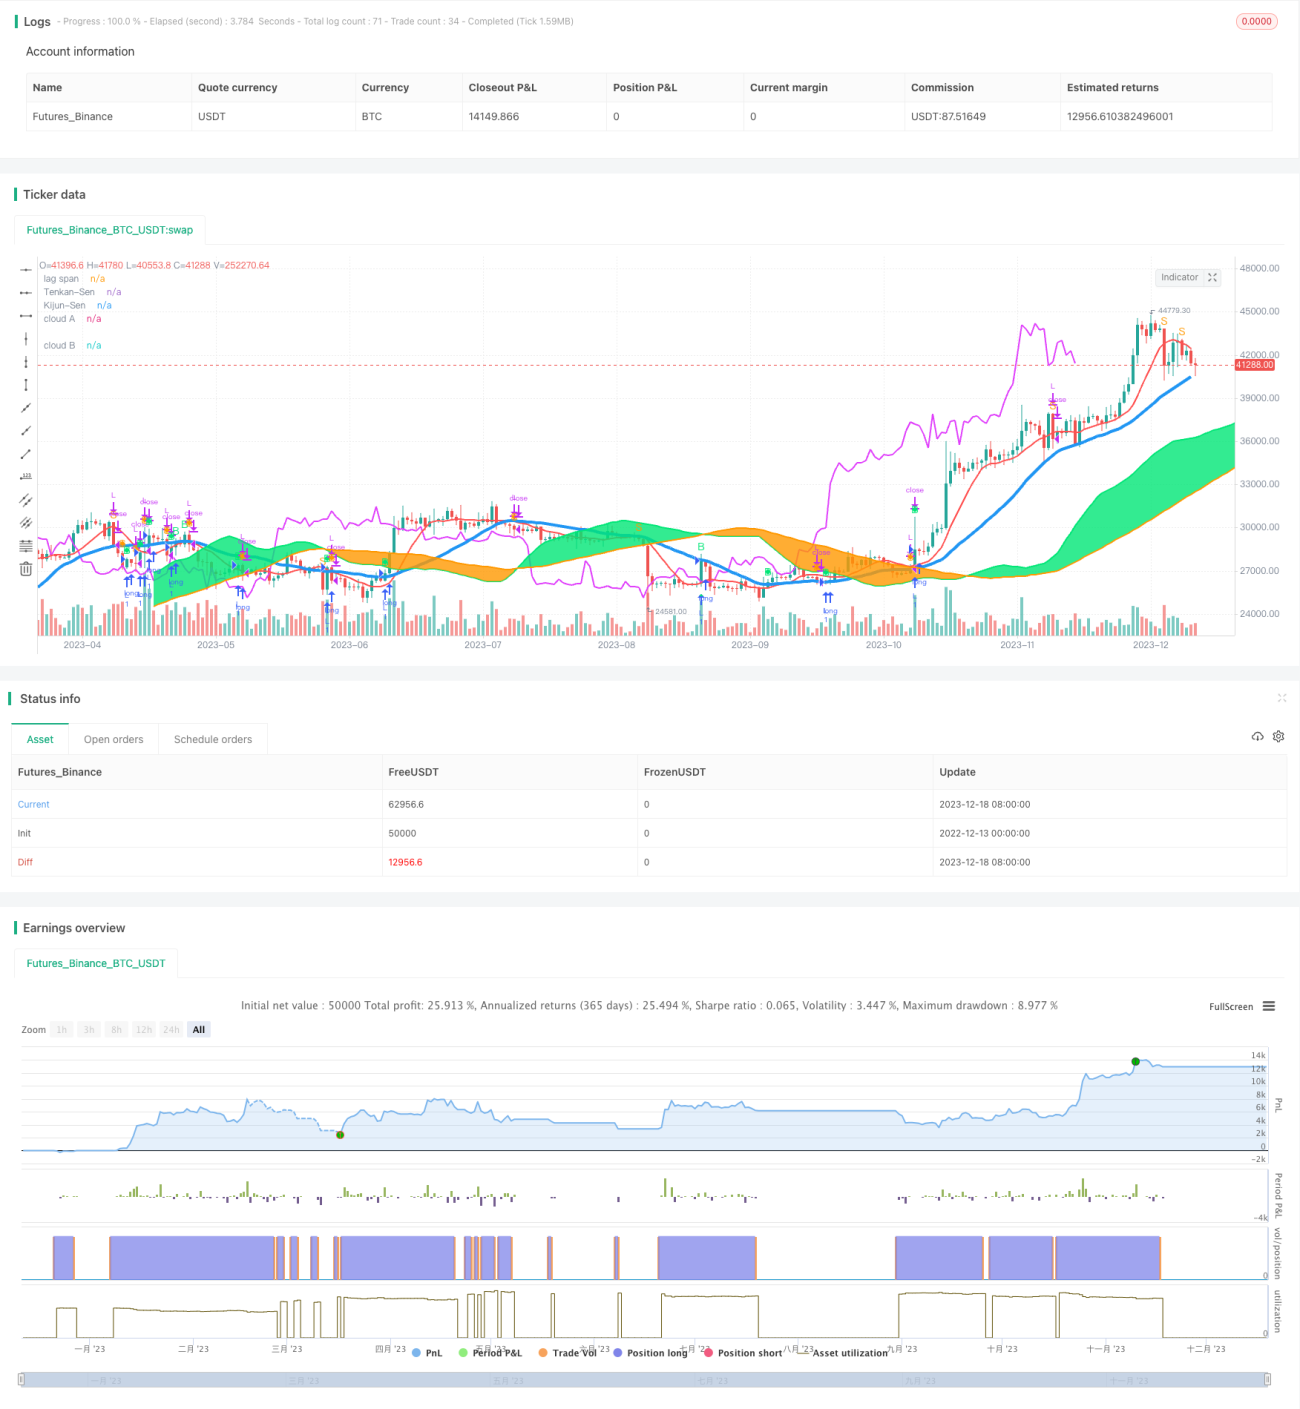
この戦略は,<unk>Ichimoku Kinko Hyo Strategy<unk>,すなわち一目均線システム戦略である. これは,一目均線に基づいて,他の技術指標と組み合わせたBTC取引戦略である.
戦略原則
この戦略は,多種多様な技術指標を統合したトレンド取引戦略システムである"目目均線システム"に基づいています.主に以下の指標が含まれています.
基準線 ((Kijun Sen):市場トレンドの方向を表し,過去26日間の高点と低点の中間点であり,サポートとレジスタンスラインとして使用できます.
変換線 ((Tenkan Sen): 株価の動態を表し,過去9日間の高点と低点のミッドポイントで,買入や売却のタイミングを判断するために使用できます.
未来SPAN A:一目平均線を代表する中間線は,基準線と変換線の平均値であり,一目平均線の警戒線として用いられる。
未来SPAN B: 長期トレンドラインを表し,過去52日の中点で,長期短期トレンドを判断する雲図を構成する.
この戦略は,RSI指標と結合して,超買い超売り領域で取引シグナルを発信する.
閉店価格が基準線を突破し,雲図の上にあるとき,買いのシグナルを生成する.閉店価格が基準線を下回り,雲図の下にあるとき,売りのシグナルを生成する.
戦略的優位性
-
一目平均線システムはトレンドを正確に判断し,勝率が高い
-
複数の指標を組み合わせて 機会を逃さないようにする
-
RSIは反転点を判断するのに有効です.
-
クラウドグラフは,長期短期トレンドを直感的に示しています.
リスク分析
-
平均線は遅れているので,他の指標と連携する必要があります.
-
トレンドマーケットの効果は良好だが,震動市場は一般的だ.
-
RSIパラメータの設定は,市場によって調整する必要があります
-
クラウドマップは複雑で,熟練した操作が必要です.
一見平均線パラメータを調整したり,より多くの技術指標を組み合わせて最適化することもできます.
最適化の方向
-
平均線のパラメータを最適化して,トレンドの判断を速める
-
移動平均などの指標を追加し,信号の正確性を向上させる.
-
RSIのパラメータ設定は,市場によって調整されます.
-
リスク管理のための減損策の導入を検討する
要約する
この戦略は,一目平均線,RSIなどの複数の指標の判断傾向を総合的に使用し,上昇傾向を判断する際に高い正確性を持っています.しかし,一目平均線システムは遅滞しており,振動を判断することができません.これは,この戦略の主なリスクです.パラメータの最適化設定,または他の指標の追加により,この欠陥を補うことができ,戦略をより安定して信頼できます.
/*backtest
start: 2022-12-13 00:00:00
end: 2023-12-19 00:00:00
period: 1d
basePeriod: 1h
exchanges: [{"eid":"Futures_Binance","currency":"BTC_USDT"}]
*/

//@version=3
strategy("My Ichimoku Strat v2", overlay=true,default_qty_type=strategy.fixed, default_qty_value=1, initial_capital=1000, currency=currency.EUR,commission_type=strategy.commission.percent,commission_value=0.05)
// === BACKTEST RANGE ===
FromMonth = input(defval = 3, title = "From Month", minval = 1)- 1