モメンタム指標反転取引戦略

1
Follow
1779
Followers
概要
この戦略は,動態指標に基づく逆転取引戦略である.市場動向を判断するために,易行指標 ((EOM) を使用し,指標が設定された<unk>値を超えると多空を行う.同時に,逆転取引機能を提供し,実際の需要に応じて正向取引または逆転取引を選択することができる.
戦略原則
易行指標 (EOM) は,価格と取引量の変化幅を測る指標である.それは同時に正負の値を返す.正値は価格上昇を表し,負値は価格下落を表す.数値が大きいほど,価格の変化が大きいほど,および/または取引量が小さいほどである.
この戦略の原理は以下の通りです.
- 現在のK線の可動性指数値を計算する
- 指数の値が設定された多値または空値を超えているかどうかを判断する
- 標準の4000以上なら,もっとやる
- 値が空白の限界以下である場合 (デフォルト-4000)
- リバーストレード機能
- 普通の状況では,負債は負債で,負債は負債です.
- 逆転の取引を開始し,マイナスで多額の取引を行い,マイナスで空白の取引を開始します.
優位分析
この戦略の主な利点は
- 価格と取引量の変化を反映した市場動向を判断する易行指標を使用する
- 設定可能な<unk>値
- リバーストレード機能が提供され,需要に応じて正向トレードまたは反向トレードを選択できます.
- K線色で判断する直感的な空白
リスク分析
この戦略の主なリスクは
- 金融指標の誤触は偽突破の危険性がある
- 不適切な<unk>値設定により,取引頻度が高くなり,取引回数が少なくなります.
- 逆転取引をする際には,十分なリスクを負うことを確認する必要があります.
解決策は
- 誤った判断を避けるために,他の指標と組み合わせる
- 値下がりパラメータを調整し,取引回数を最適化
- リスクの真価を正しく評価する
最適化の方向
この戦略は以下の方向から最適化できます.
- 移動平均などの指標を組み合わせて,偽突破を避ける
- ストップ・メカニズムの追加
- オプティマイゼーションパラメータ,多空の値下げ調整
- ポジション開設条件を高め,頻繁に取引を避ける
- リバース取引のリスク管理策を設定する
戦略を安定させ,リスクを軽減し,実盤の効果を向上させることができる.
要約する
全体として,この戦略は,市場が実際に動いていることを判断する動きの指標を使用し,過剰な利益を得るために,多額の多額の利益を得ます.それは,価格の変動と取引量の変化の両方の要因を考慮しながら,簡単に使用できます. 实体的に使用した場合,他の技術指標と組み合わせて,適切なパラメータを最適化することをお勧めすると,より良い効果が得られます.
Source
Pine
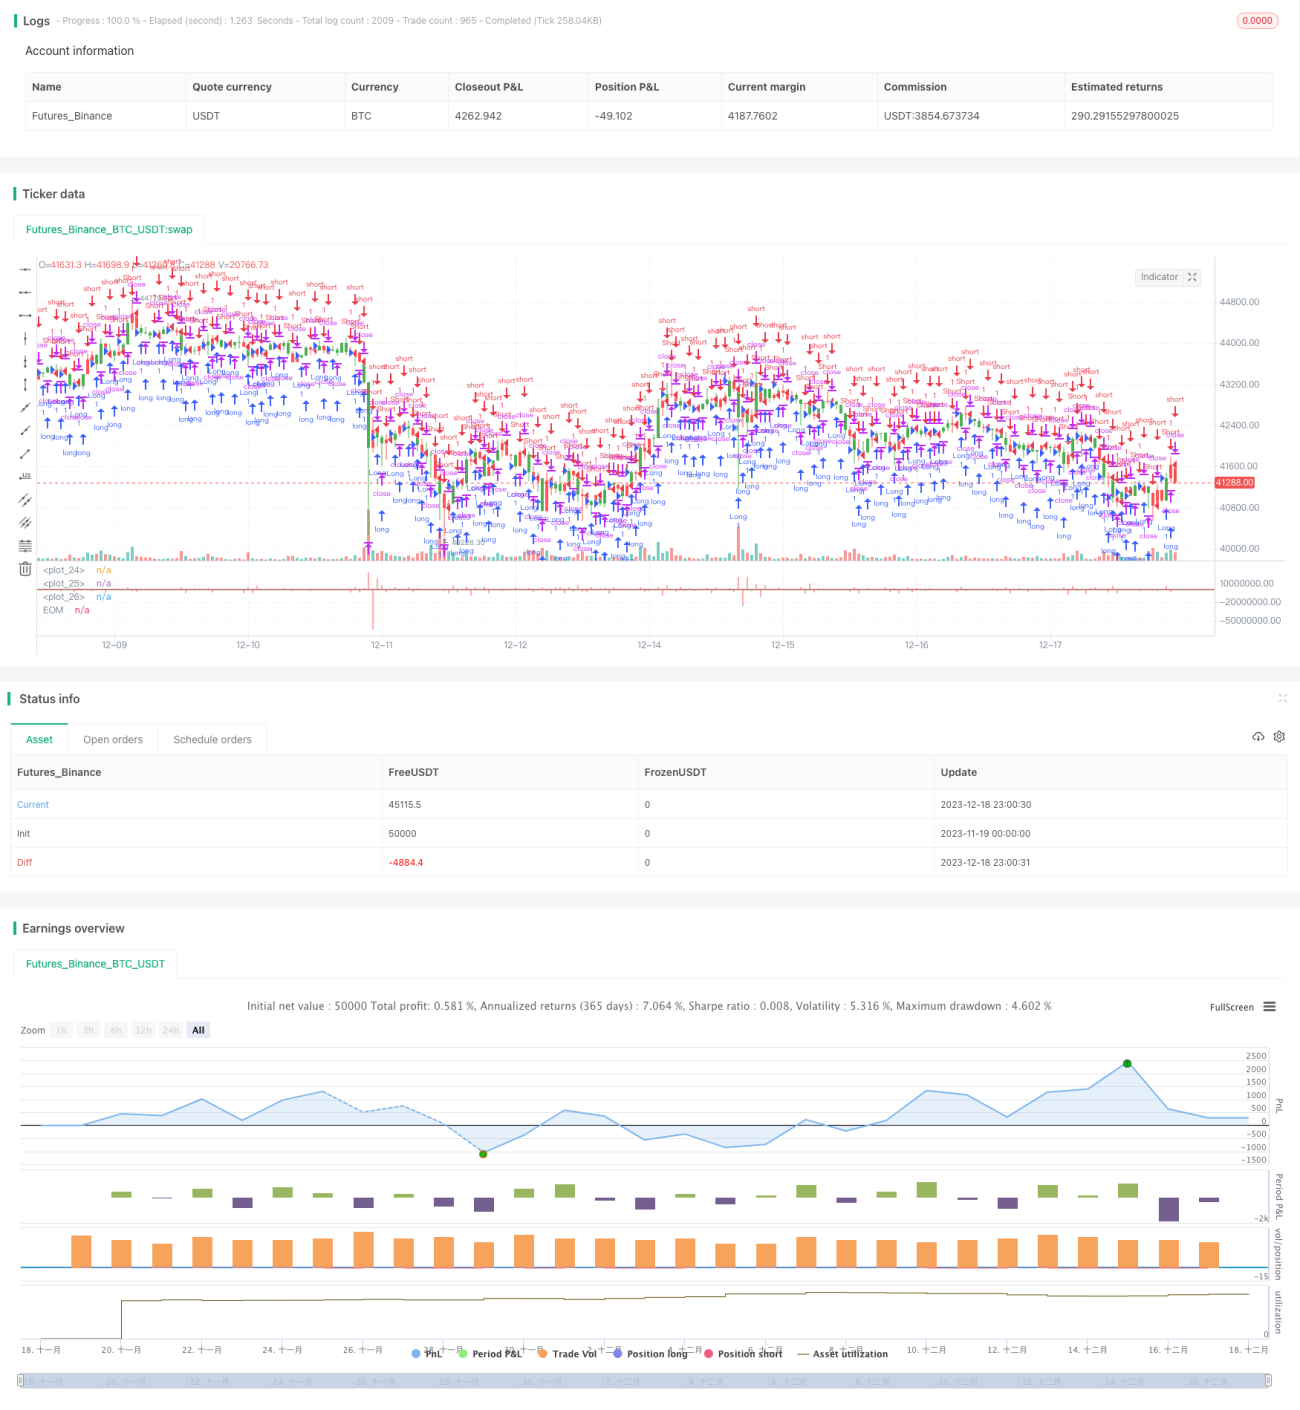
/*backtest
start: 2023-11-19 00:00:00
end: 2023-12-19 00:00:00
period: 1h
basePeriod: 15m
exchanges: [{"eid":"Futures_Binance","currency":"BTC_USDT"}]
*/

//@version=2
////////////////////////////////////////////////////////////
//  Copyright by HPotter v1.0 19/06/2018
// This indicator gauges the magnitude of price and volume movement. Strategy parameters
Related strategies
Comment
All comments (0)
No data
- 1