動的移動平均取引戦略
概要
この戦略は,動的移動平均を計算し,それを取引の信号として使って,株価が上昇する時に高額で,株価が低下する時に平額にする.この戦略は,動量指標と移動平均の優位性を組み合わせて,株価の中間期トレンドを追跡し,安定した利益を達成することを目的としている.
原則
この策略は,主に3つの変数のハル移動平均に基づいている.これには,通常のハル移動平均 ((HMA),加重ハル移動平均 ((WHMA),指数的なハル移動平均 ((EHMA) が含まれる.コードによると,この策略は,ユーザが3つのハルMAの間で切り替えるのを許可している.
HMAの計算式は次のとおりです.
HMA = WMA(2*WMA(close,n/2)-WMA(close,n),sqrt(n))
その中,WMAは重引移動平均を表し,nは周期パラメータを表します.HMAは,SMA (単純移動平均) よりも価格変化により迅速に反応します.
WHMAとEHMAの計算式は,HMAと同じである. HMAをデフォルトで選択する方針である.
HMAを計算した後,この戦略は,HMAの中線値を取引信号として使用します.価格がHMAの中線を突破すると,多入場を行います.価格がHMA中線を突破すると,平出場を行います.このように,HMA中線を使用して,価格の中期トレンドを追跡し,利益を上げます.
利点
従来の移動平均策略と比較して,この策略は以下の利点があります.
- より迅速な対応,トレンド追跡,早期入場とストップ損失
- 取引の頻度を減らして,不況を回避する
- Hull MAのパラメータを柔軟に配置し,より広範な市場環境に対応します.
- HMA,WHMA,EHMAを切り替え,適用範囲を広げることができる
リスク
この戦略にはいくつかのリスクがあります.
- 取引頻度と滑り場コストを増加させるため,収束状況で複数の無効信号を生成する可能性があります.
- Hull MAパラメータの設定を間違えた場合,トレンドの逆転点を逃し,損失のリスクを増やす
- 株の選択が間違って流動性が悪い株を選んだ場合,大きな滑落に遭う可能性があります.
対策として
- ハルMAのパラメータを最適化して最適値を見つけます.
- 他の指標と組み合わせると,トレンドの転換点
- 流動性があり,日平均取引量が高い株を選びましょう.
最適化の方向
この戦略は,以下の点で最適化できます.
- 取引量または他の指標のフィルタを増加させ,取引信号の信頼性を確保する
- MACD,KDJなどの他の指標と組み合わせて,入場タイミングを判断し,勝率を高めます.
- ホールMA周期パラメータを,リッドディスクの回測データに基づいて調整
- WHMAまたはEHMAに切り替え,特定の株式で最高のパフォーマンスをテストするHullの変種
- 単一損失をコントロールするストップ・ストラトジーを増やす
要約する
この動的平均取引戦略は,ハルMAの迅速な反応の優位性を統合し,株価の中期トレンドを効果的に追跡し,適切なタイミングでポジションを多く開き,損失を止め,歴史を振り返って良好なパフォーマンスを発揮します.この戦略は,パラメータ設定をさらに最適化し,株の範囲を選択することで,より安定した余剰利益を得ることができます.これは実行しやすい,リスクが制御可能な量化戦略です.
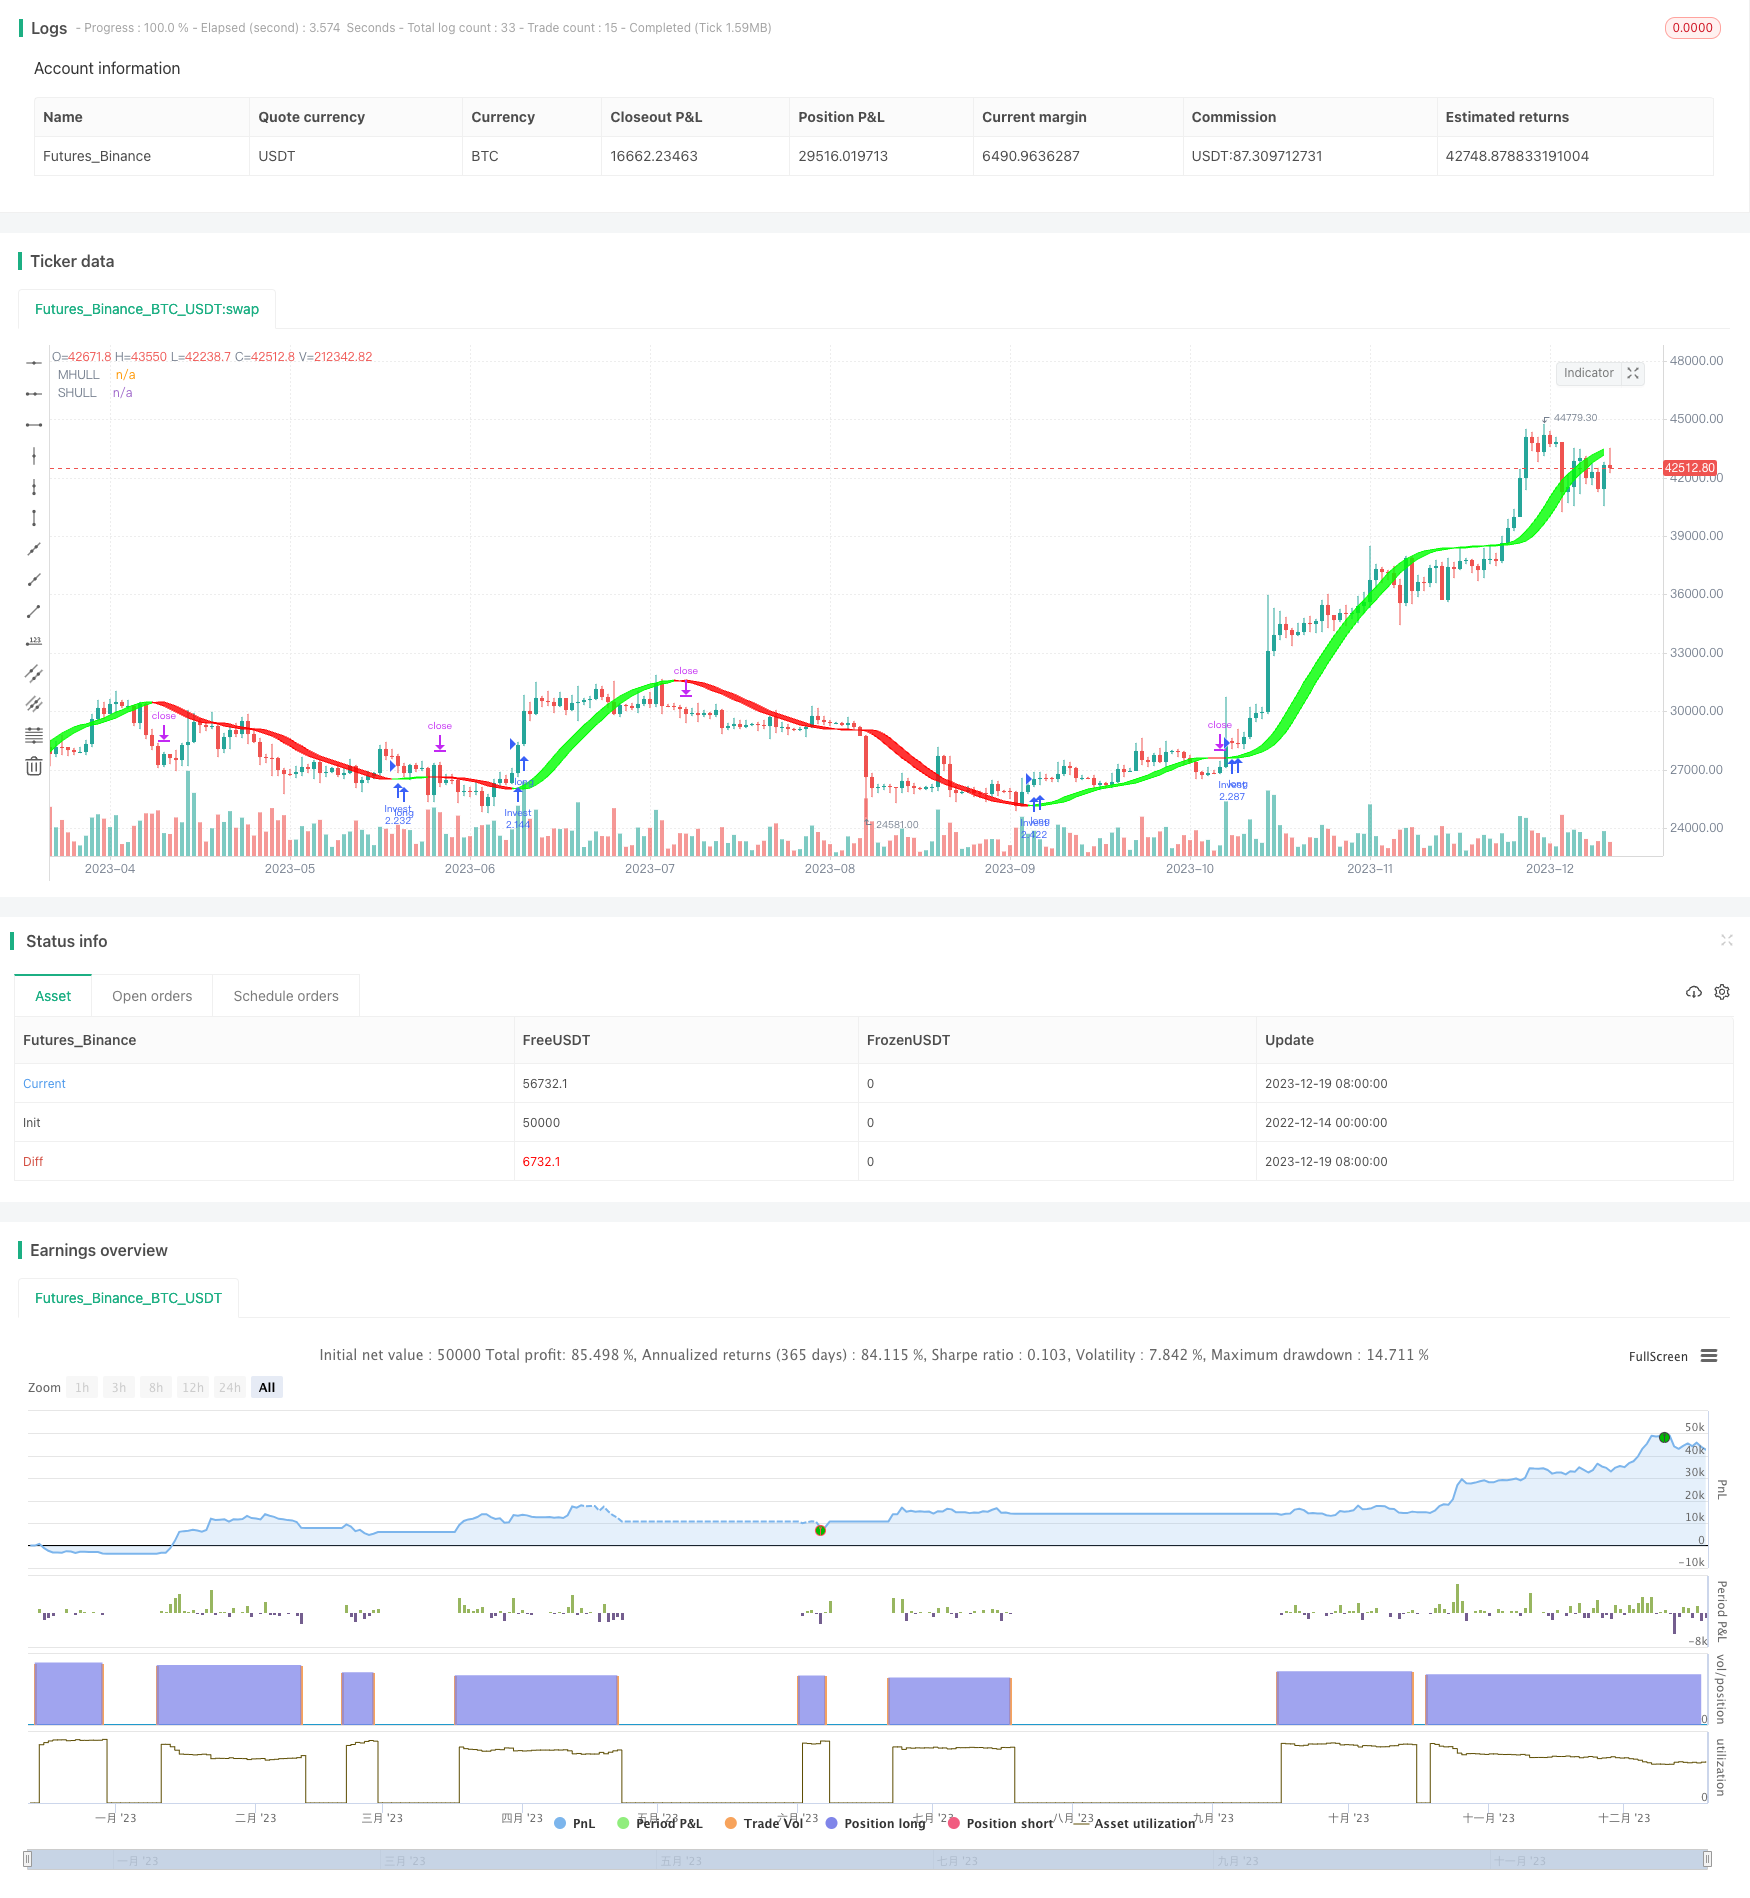
/*backtest
start: 2022-12-14 00:00:00
end: 2023-12-20 00:00:00
period: 1d
basePeriod: 1h
exchanges: [{"eid":"Futures_Binance","currency":"BTC_USDT"}]
*/

//@version=5
strategy('Position Investing by SirSeff', overlay=true, pyramiding=1, default_qty_type=strategy.percent_of_equity, default_qty_value=100, calc_on_order_fills=false, slippage=0, commission_type=strategy.commission.percent, commission_value=0)
strat_dir_input = input.string(title='Strategy Direction', defval='long', options=['long', 'short', 'all'])
strat_dir_value = strat_dir_input == 'long' ? strategy.direction.long : strat_dir_input == 'short' ? strategy.direction.short : strategy.direction.all
strategy.risk.allow_entry_in(strat_dir_value)
//////////////////////////////////////////////////////////////////////
// Testing Start dates
testStartYear = input(2000, 'Backtest Start Year')
testStartMonth = input(1, 'Backtest Start Month')
testStartDay = input(1, 'Backtest Start Day')
testPeriodStart = timestamp(testStartYear, testStartMonth, testStartDay, 0, 0)
//Stop date if you want to use a specific range of dates
testStopYear = input(2030, 'Backtest Stop Year')
testStopMonth = input(12, 'Backtest Stop Month')
testStopDay = input(30, 'Backtest Stop Day')
testPeriodStop = timestamp(testStopYear, testStopMonth, testStopDay, 0, 0)


testPeriod() => true
// Component Code Stop
//////////////////////////////////////////////////////////////////////
//INPUT
src = input(close, title='Source')
modeSwitch = input.string('Hma', title='Hull Variation', options=['Hma', 'Thma', 'Ehma'])
length = input(55, title='Length(180-200 for floating S/R , 55 for swing entry)')
switchColor = input(true, 'Color Hull according to trend?')
candleCol = input(false, title='Color candles based on Hull\'s Trend?')
visualSwitch = input(true, title='Show as a Band?')
thicknesSwitch = input(1, title='Line Thickness')
transpSwitch = input.int(40, title='Band Transparency', step=5)

//FUNCTIONS
//HMA
HMA(_src, _length) =>
    ta.wma(2 * ta.wma(_src, _length / 2) - ta.wma(_src, _length), math.round(math.sqrt(_length)))
//EHMA
EHMA(_src, _length) =>
    ta.ema(2 * ta.ema(_src, _length / 2) - ta.ema(_src, _length), math.round(math.sqrt(_length)))
//THMA
THMA(_src, _length) =>
    ta.wma(ta.wma(_src, _length / 3) * 3 - ta.wma(_src, _length / 2) - ta.wma(_src, _length), _length)

//SWITCH
Mode(modeSwitch, src, len) =>
    modeSwitch == 'Hma' ? HMA(src, len) : modeSwitch == 'Ehma' ? EHMA(src, len) : modeSwitch == 'Thma' ? THMA(src, len / 2) : na

//OUT
HULL = Mode(modeSwitch, src, length)
MHULL = HULL[0]
SHULL = HULL[2]

//COLOR
hullColor = switchColor ? HULL > HULL[2] ? #00ff00 : #ff0000 : #ff9800

//PLOT
///< Frame
Fi1 = plot(MHULL, title='MHULL', color=hullColor, linewidth=thicknesSwitch, transp=50)
Fi2 = plot(visualSwitch ? SHULL : na, title='SHULL', color=hullColor, linewidth=thicknesSwitch, transp=50)
///< Ending Filler
fill(Fi1, Fi2, title='Band Filler', color=hullColor, transp=transpSwitch)
///BARCOLOR
barcolor(color=candleCol ? switchColor ? hullColor : na : na)


if HULL[0] > HULL[2] and testPeriod()
    strategy.entry('Invest', strategy.long)
if HULL[0] < HULL[2] and testPeriod()
    strategy.entry('Pause', strategy.short)