EMAゴールデンクロスプルバック戦略
作成日:
2023-12-21 11:48:54
最終変更日:
2023-12-21 11:48:54
コピー:
2
クリック数:
1063
1
フォロー
1751
フォロワー
概要
EMAゴールド・クロス・リターン戦略は,EMA指標に基づく量化取引戦略である.この戦略は,3つの異なる周期のEMA曲線を使用して取引信号を構築し,価格リターンメカニズムと組み合わせてストップ・ロストを設定し,取引を自動化する.
戦略原則
この戦略は,以下の3つのEMA曲線を使用しています.
- EMA1: 価格回調のサポート/レジスタンス位置を判断するために使用される.周期は短い,デフォルトは33サイクルである.
- EMA2:部分的な反転信号をフィルタリングするために使用され,周期はEMA1の5倍で,デフォルトは165周期である.
- EMA3:全体的なトレンドの方向を判断するために,周期はEMA1の11倍で,デフォルトは365周期である.
取引シグナルの生成は以下の論理に従います.
多頭シグナル:価格がEMA1を構成した後に反動が起こり,EMA1の上方より高い低点を形成し,反動幅はEMA2に触れない.条件を満たした後,再びEMA1を構成するときに多行する.
空頭シグナル:価格がEMA1を下を通過した後に逆調が起こり,EMA1の下ではより低い高点が形成され,逆調の幅はEMA2に触れない.条件を満たした後,再びEMA1を下を通過する際に空調をすること.
止損方法は,最低価格/最高価格をリセットする.止損は止損の2倍に設定する.
戦略的優位性
この戦略の利点は以下の通りです.
- EMA指標を使って取引信号を構築し,信頼性が高い.
- 価格調整のメカニズムと組み合わせれば, 落札を効果的に回避できます.
- ストップダストポイントは,リスクを効果的に制御するために,以前の高低値に設定されます.
- ストップ・ストップ・ロスの比率に従ってストップ・ポイントを設定し,利益・損失比率要件を満たす.
- 市場に応じてEMAパラメータを調整して,異なる周期に対応できます.
戦略リスク
この戦略にはリスクもあります.
- EMAの指標は遅滞しており,トレンドの転換点を逃している可能性がある.
- EMA2を超える回调範囲は,偽信号を生成する可能性がある.
- トレンド・ストップ・ローズは破られるかもしれない.
- パラメータを正しく設定しない場合,取引が頻発し,機会が失われる可能性があります.
EMA周期調整,回調制限範囲などの方法によってパラメータを最適化することができる。また,他の指標のフィルター信号と組み合わせることができる。
戦略最適化の方向性
この戦略は,以下の点で最適化できます.
- トレンド指数判断を増やし,逆転取引を避ける.例えばMACDに加入する.
- 取引量指標を追加し,偽の突破を避ける.例えばOBVに加入する.
- EMA周期パラメータを最適化するか,または自主的にEMAを採用する.
- 単語袋モデルなどの機械学習方法と組み合わせた動的最適化パラメータ.
- モデルの予測に加わり,自律的な止損停止を設定します.
要約する
EMA黄金交差回調策は,三EMA取引システムを構築し,価格回調の特徴と組み合わせてストップ・ストロスを設定することで,自動取引を実現している.この戦略は,取引リスクを効果的に制御し,市場に応じてパラメータの調整によって最適化することができる.全体的に,この戦略は論理的に合理的で実用的に適用できる.将来,トレンド判断パラメータ,パラメータの最適化,リスク管理などからさらに最適化することができる.
ストラテジーソースコード
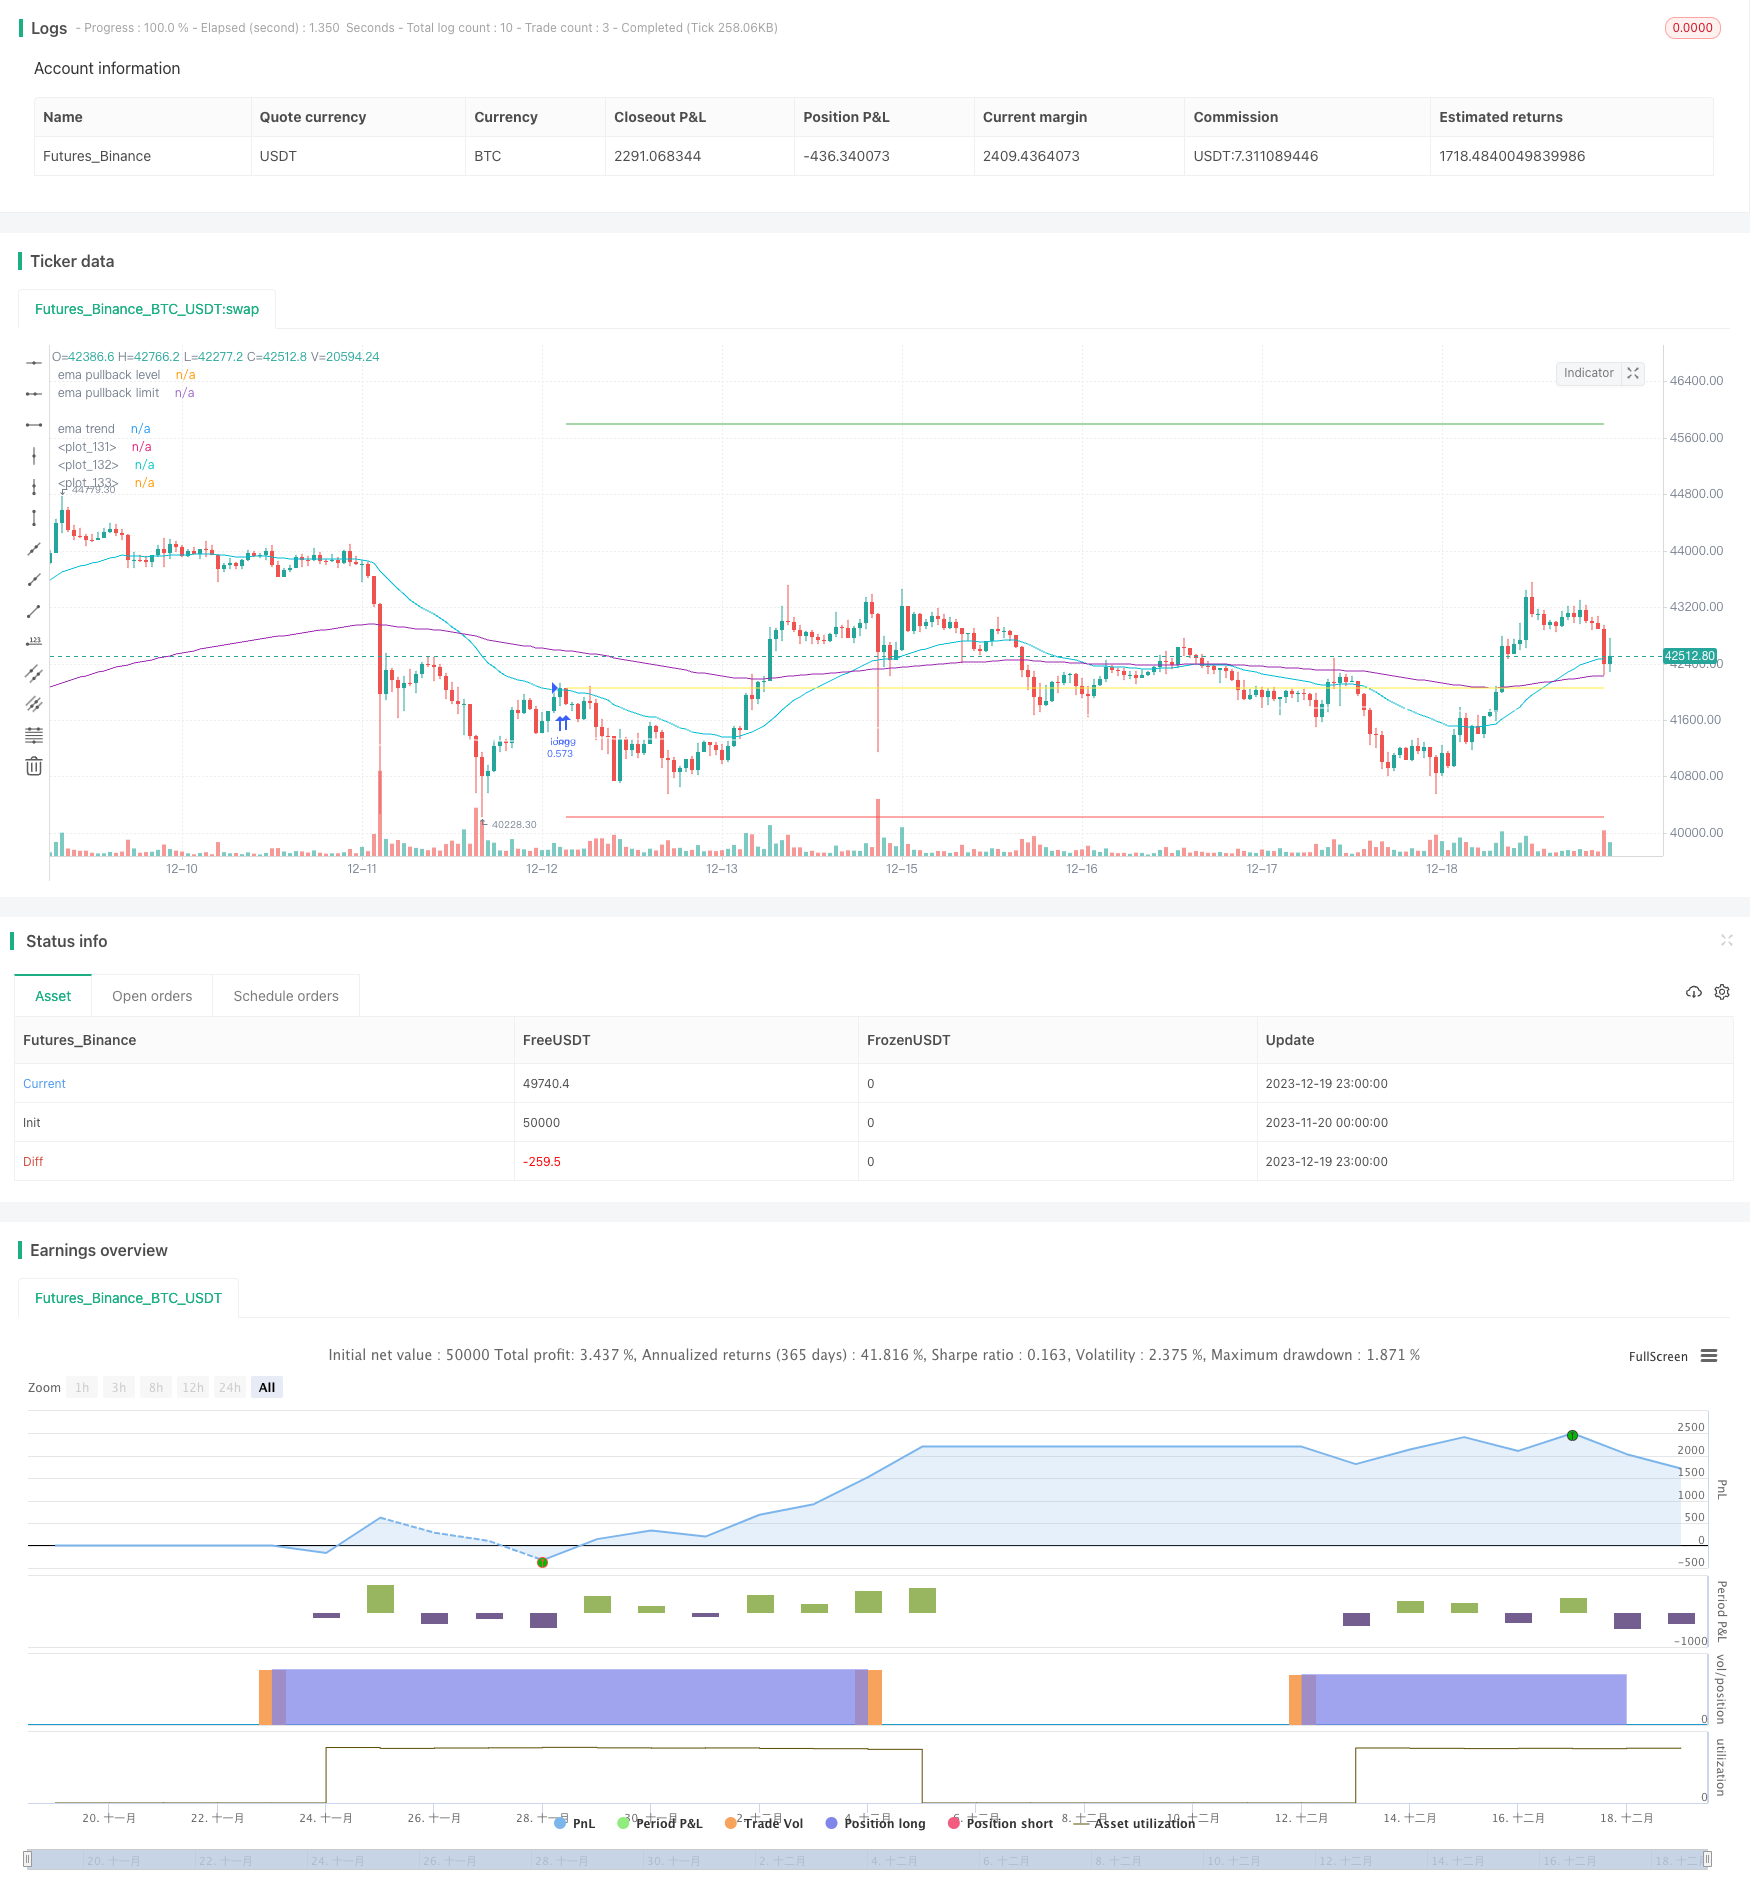
/*backtest
start: 2023-11-20 00:00:00
end: 2023-12-20 00:00:00
period: 1h
basePeriod: 15m
exchanges: [{"eid":"Futures_Binance","currency":"BTC_USDT"}]
*/

// This source code is subject to the terms of the Mozilla Public License 2.0 at https://mozilla.org/MPL/2.0/
// created by Space Jellyfish
//@version=4

strategy("EMA pullback strategy", overlay = true, initial_capital=10000, commission_value = 0.075)

target_stop_ratio = input(title="Take Profit Stop Loss ratio", type=input.float, defval=2.06, minval=0.5, maxval=100)
riskLimit_low =  input(title="lowest risk per trade", type=input.float, defval=0.008, minval=0, maxval=100)
riskLimit_high =  input(title="highest risk per trade", type=input.float, defval=0.02, minval=0, maxval=100)
//give up the trade, if the risk is smaller than limit, adjust position size if risk is bigger than limit

ema_pullbackLevel_period = input(title="EMA1 for pullback level Period", type=input.integer, defval=33, minval=1, maxval=10000)
ema_pullbackLimiit_period = input(title="EMA2 for pullback limit Period", type=input.integer, defval=165, minval=1, maxval=10000)
ema_trend_period = input(title="EMA3 for trend Period", type=input.integer, defval=365, minval=1, maxval=10000)

startDate = input(title="Start Date", type=input.integer, defval=1, minval=1, maxval=31)
startMonth = input(title="Start Month", type=input.integer, defval=1, minval=1, maxval=12)
startYear = input(title="Start Year", type=input.integer, defval=2018, minval=2008, maxval=2200)

inDateRange = (time >= timestamp(syminfo.timezone, startYear, startMonth, startDate, 0, 0))

ema_pullbackLevel = ema(close, ema_pullbackLevel_period)
ema_pullbackLimit = ema(close, ema_pullbackLimiit_period)
ema_trendDirection = ema(close, ema_trend_period)

//ema pullback
float pricePullAboveEMA_maxClose = na
float pricePullAboveEMA_maxHigh = na

float pricePullBelowEMA_minClose = na
float pricePullBelowMA_minLow = na

if(crossover(close, ema_pullbackLevel))
    pricePullAboveEMA_maxClose := close
    pricePullAboveEMA_maxHigh := high
else
    pricePullAboveEMA_maxClose := pricePullAboveEMA_maxClose[1]
    pricePullAboveEMA_maxHigh := pricePullAboveEMA_maxHigh[1]

if(close > pricePullAboveEMA_maxClose)
    pricePullAboveEMA_maxClose := close
if(high > pricePullAboveEMA_maxHigh)
    pricePullAboveEMA_maxHigh := high

if(crossunder(close, ema_pullbackLevel))
    pricePullBelowEMA_minClose := close
    pricePullBelowMA_minLow := low
else
    pricePullBelowEMA_minClose :=pricePullBelowEMA_minClose[1]
    pricePullBelowMA_minLow:=pricePullBelowMA_minLow[1]

if(close < pricePullBelowEMA_minClose)
    pricePullBelowEMA_minClose := close
if(low < pricePullBelowMA_minLow)
    pricePullBelowMA_minLow := low


long_strategy = crossover(close, ema_pullbackLevel) and pricePullBelowEMA_minClose < ema_pullbackLimit and ema_pullbackLevel>ema_trendDirection
short_strategy = crossunder(close, ema_pullbackLevel) and pricePullAboveEMA_maxClose > ema_pullbackLimit and ema_pullbackLevel<ema_trendDirection


var open_long_or_short = 0// long = 10000, short = -10000, no open = 0

//check if position is closed
if(strategy.position_size == 0)
    open_long_or_short := 0
else
    open_long_or_short := open_long_or_short[1]

float risk_long = na
float risk_short = na
float stopLoss = na
float takeProfit = na
float entry_price = na

float entryContracts = 0


risk_long := risk_long[1]
risk_short := risk_short[1]

//open a position determine the position size
if (strategy.position_size == 0 and long_strategy and inDateRange)
    risk_long := (close - pricePullBelowMA_minLow) / close

    if(risk_long < riskLimit_high)
        entryContracts := strategy.equity / close
    else
        entryContracts := (strategy.equity * riskLimit_high / risk_long)/close

    if(risk_long > riskLimit_low)
        strategy.entry("long", strategy.long, qty = entryContracts, when = long_strategy)


    open_long_or_short := 10000

if (strategy.position_size == 0 and short_strategy and inDateRange)
    risk_short := (pricePullAboveEMA_maxHigh - close) / close
    if(risk_short < riskLimit_high)
        entryContracts := strategy.equity / close
    else
        entryContracts := (strategy.equity * riskLimit_high / risk_short)/close

    if(risk_short > riskLimit_low)
        strategy.entry("short", strategy.short, qty = entryContracts, when = short_strategy)


    open_long_or_short := -10000

//take profit / stop loss
if(open_long_or_short == 10000)

    stopLoss :=   strategy.position_avg_price*(1 - risk_long)
    takeProfit :=  strategy.position_avg_price*(1 + target_stop_ratio * risk_long)
    entry_price := strategy.position_avg_price
    strategy.exit("Long exit","long", limit = takeProfit , stop = stopLoss)

if(open_long_or_short == -10000)
    stopLoss :=  strategy.position_avg_price*(1 + risk_short)
    takeProfit :=  strategy.position_avg_price*(1 - target_stop_ratio * risk_short)
    entry_price := strategy.position_avg_price
    strategy.exit("Short exit","short", limit = takeProfit, stop = stopLoss)


plot(ema_pullbackLevel, color=color.aqua,  title="ema pullback level")
plot(ema_pullbackLimit, color=color.purple,  title="ema pullback limit")
plot(ema_trendDirection, color=color.white,  title="ema trend")

plot(entry_price, color = color.yellow, linewidth = 1, style = plot.style_linebr)
plot(stopLoss, color = color.red, linewidth = 1, style = plot.style_linebr)
plot(takeProfit, color = color.green, linewidth = 1, style = plot.style_linebr)


//