複数の時間に基づくトリプルスーパートレンド戦略
概要
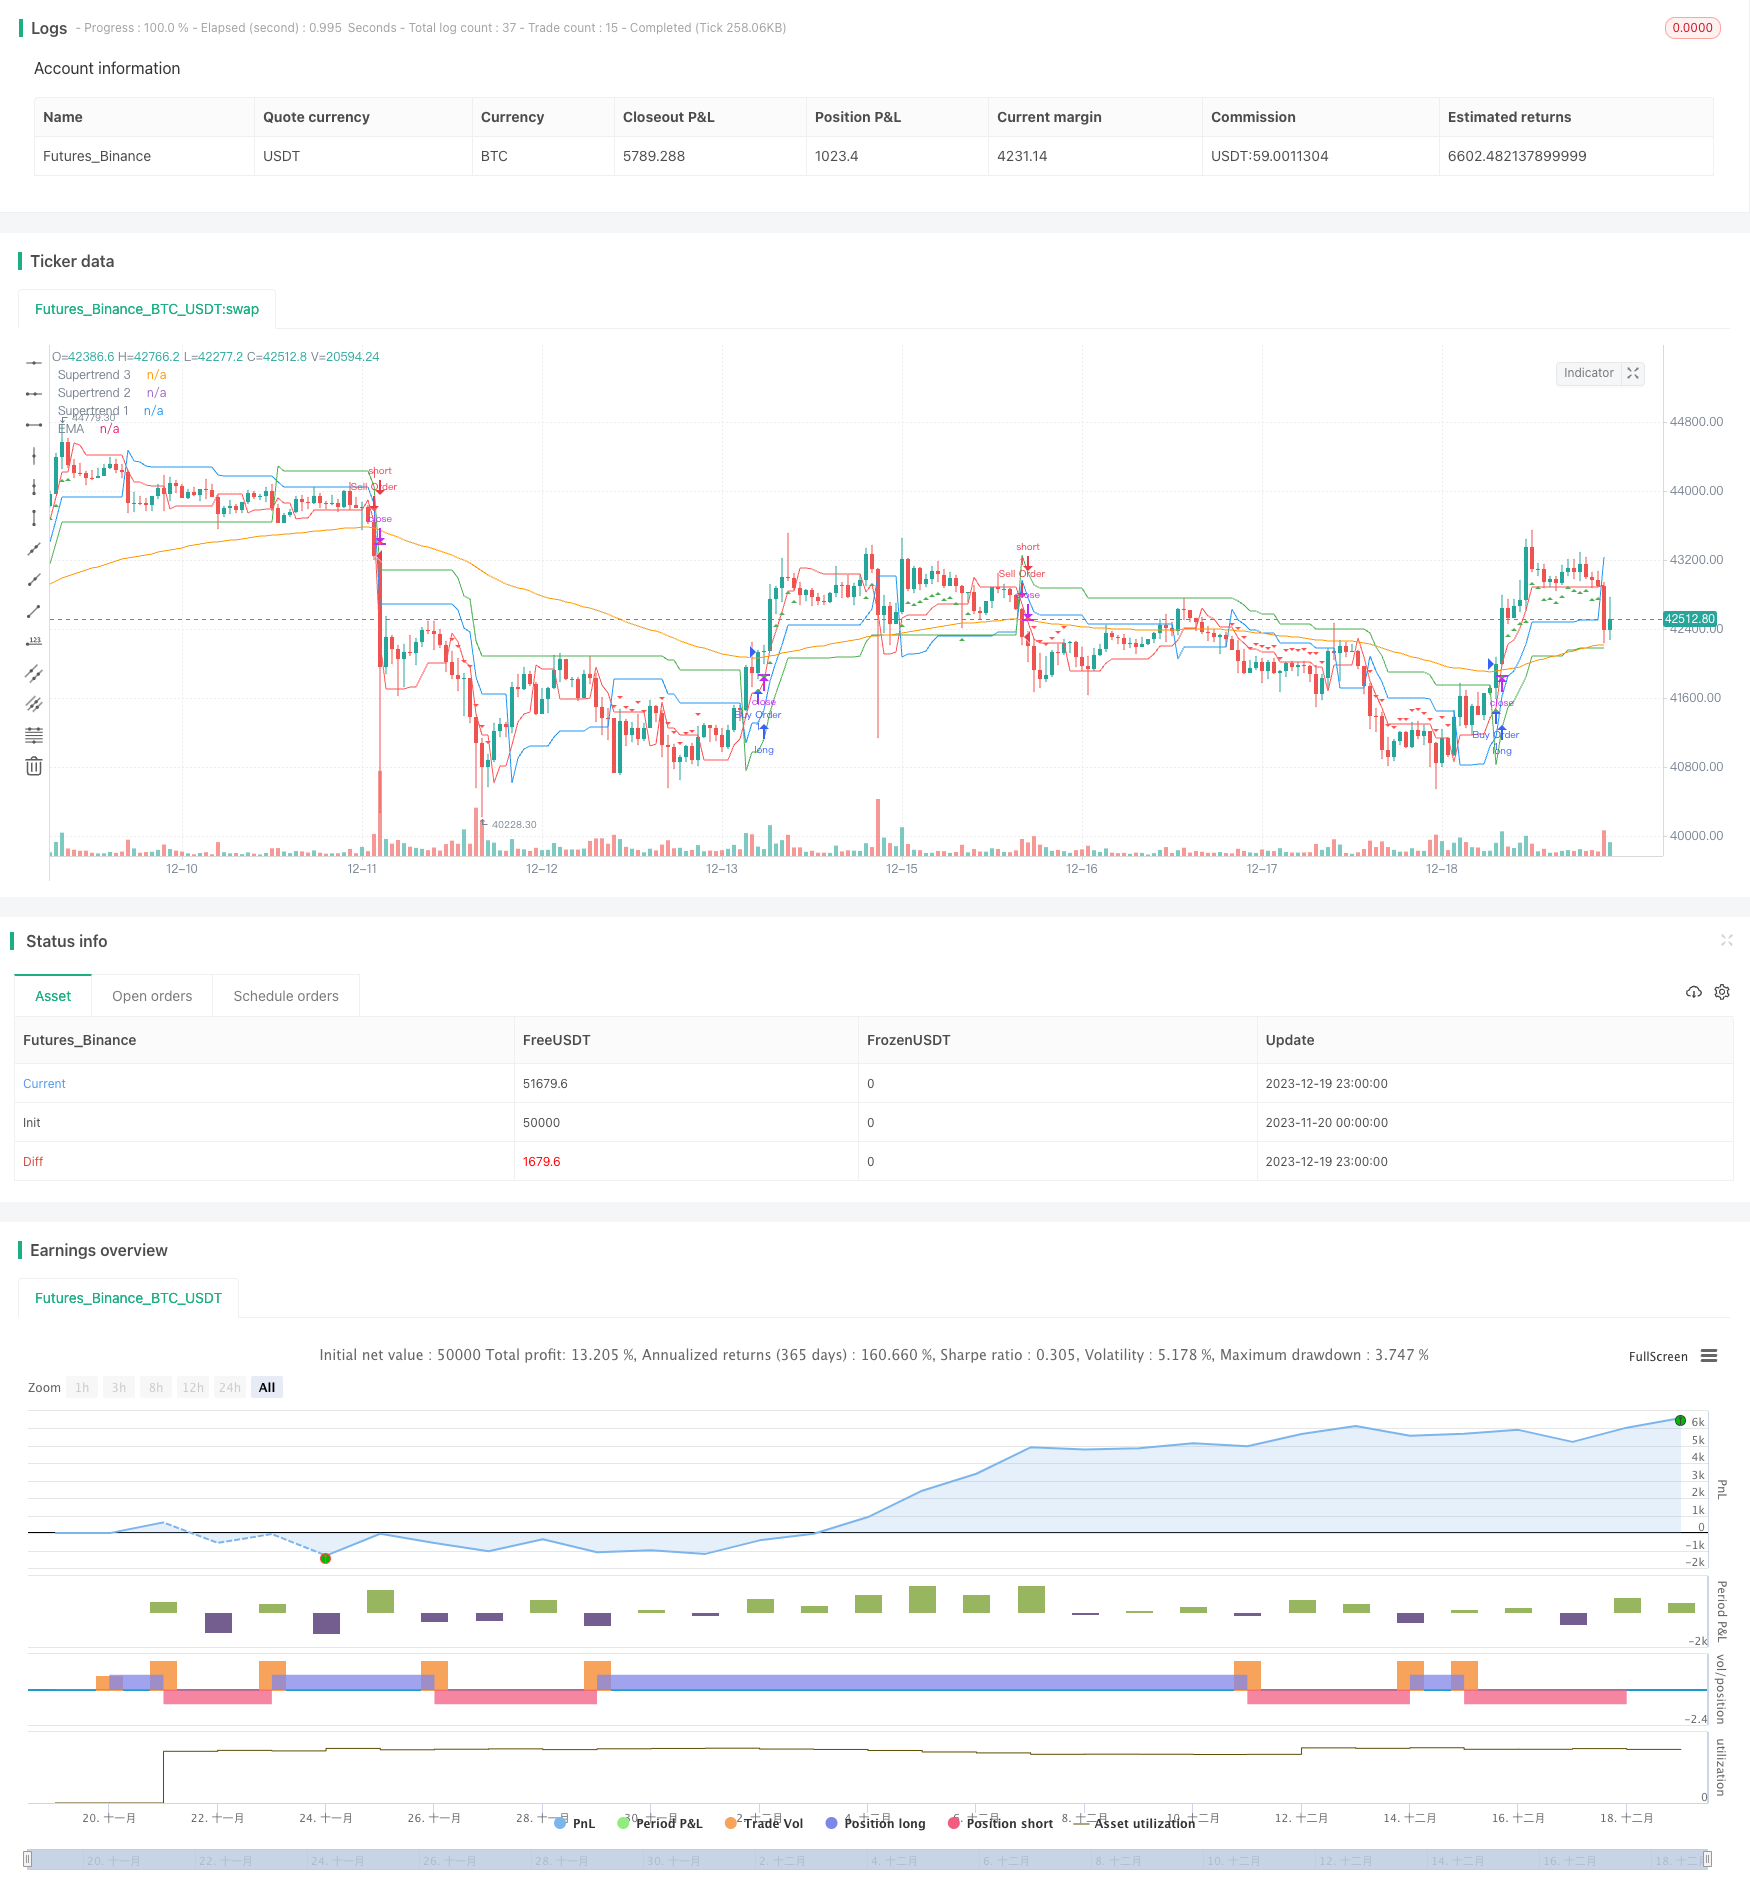
トリプル超トレンド戦略は,複数の時間周期にわたる超トレンド指標と移動平均に基づくトレンドフォロー戦略である.それは,トレンドの方向を効果的に識別し,トレンドが形成されたときに間に合うように入場し,トレンドが逆転したときに間に合うように退場し,利益を得ることができる.単一の超トレンド戦略と比較して,トリプル超トレンド戦略は,市場のトレンドをより正確に描写し,偽突破による損失を避ける.
戦略原則
この戦略は,3つの異なるパラメータ設定の超トレンド指標を同時に使用します:超トレンド1,超トレンド2および超トレンド3。それらの周期長さは,入力パラメータsupertrend1_period,supertrend2_periodおよびsupertrend3_periodにそれぞれ長から短に変わります。3つの超トレンド指標は,移動平均EMAと連携して機能します.具体的ロジックは次のとおりです:
多頭入場シグナル: 閉盤価格が超トレンドラインと移動平均の3つ以上であるとき,多頭入場シグナル;
空頭入場シグナル:閉盤価格が超トレンドラインと移動平均の3つを下回ったときに空頭する.
このように,異なる周期の超トレンド指標は,相互検証の役割を果たし,市場トレンドの歪曲を避けることができます.移動平均EMAを加えると,部分的な偽突破をフィルターすることができます.
戦略的優位性
三重超トレンドシステムを使用すると,より正確にトレンドを判断し,偽突破の誤導を回避できます.
異なるパラメータ設定の超トレンド指標は相互検証し,戦略をより信頼できます.
移動平均フィルターを追加することで,小周期の騒音をさらに回避できます.
戦略は合理的であり,トレンドを追跡して利益を得たり,リスクをコントロールするために,タイムリーに退出したりできます.
戦略的リスクと解決策
超トレンド指標は遅滞しており,入場時間が少し遅れる可能性があります.パラメータを適切に調整したり,他の先行指標を追加したりできます.
移動平均はフィルターとしても滞りがある.他の平滑指数であるEMA,運動指数などの代替をテストすることができる.
トレンドが逆転すると,損失が増加する可能性があります. ストップポイントを設定したり,潜在的な逆転を判断する追加の指標を追加したりできます.
パラメータの設定が不適切であることも,戦略の効果に影響する.最適なパラメータの組み合わせを見つけるために十分なフィードバック最適化が必要である.
戦略最適化の方向性
テストは,MACD,DMIなどの他のトレンド判断指標を加え,トレンド判断の正確性を検証する.
超トレンドの周期と倍数は,異なる市場環境に自律的に適応できるように,パラメータを自動的に最適化しようとします.
ダイナミックなストップ・ロズとストップ・ストップ条件を設定し,戦略がリアルタイムで波動した利回り比率を自動的に調整できるようにする.
移動平均のパラメータを最適化するか,他の指標を導入して偽突破信号をフィルターする.
より長い時間周期 (日線,周線など) で動作する戦略をテストし,大トレンドの下での捕獲効果を判断する.
要約する
三重超トレンド戦略は,同時に3組のパラメータを異なる超トレンド指標を使用し,相互検証してトレンド方向を判断し,移動平均と組み合わせてフィルタリングを行うことで,トレンドを効果的に識別し,タイムリーに入場し,偽突破を避ける,信頼できるトレンドフォロー戦略です. この戦略は,パラメータ最適化,止損機構の改善,他の指標の追加など,複数の方法でエグレッダメントすることができ,中線長さのトレンドを捕捉しながらリスクを制御し,広範囲の最適化スペースを持っています.
/*backtest
start: 2023-11-20 00:00:00
end: 2023-12-20 00:00:00
period: 1h
basePeriod: 15m
exchanges: [{"eid":"Futures_Binance","currency":"BTC_USDT"}]
*/

//@version=5
strategy("Triple Supertrend Strategy", shorttitle = "TSS", overlay = true, pyramiding = 1) // Added pyramiding = 1

// Define input settings for Supertrend indicators
supertrend1_period = input.int(3, title = "Supertrend 1 Period")
supertrend1_multiplier = input.int(12, title = "Supertrend 1 Multiplier")
supertrend2_period = input.int(2, title = "Supertrend 2 Period")
supertrend2_multiplier = input.int(11, title = "Supertrend 2 Multiplier")
supertrend3_period = input.int(1, title = "Supertrend 3 Period")
supertrend3_multiplier = input.int(10, title = "Supertrend 3 Multiplier")

// EMA settings with user-defined length
ema_length = input.int(100, title = "EMA Length")

// Calculate Supertrend values for all three indicators
[supertrend1_value, _] = ta.supertrend(supertrend1_period, supertrend1_multiplier)
[supertrend2_value, _] = ta.supertrend(supertrend2_period, supertrend2_multiplier)
[supertrend3_value, _] = ta.supertrend(supertrend3_period, supertrend3_multiplier)

// Calculate EMA
ema = ta.ema(close, ema_length)

// Define long entry condition
longCondition = close > ema and close > supertrend1_value and close > supertrend2_value and close > supertrend3_value

// Define short entry condition
shortCondition = close < ema and close < supertrend1_value and close < supertrend2_value and close < supertrend3_value

// Strategy orders
if (longCondition)
    strategy.entry("Buy Order", strategy.long)
if (shortCondition)
    strategy.entry("Sell Order", strategy.short)

// Plot Supertrends and EMA for reference
plot(supertrend1_value, title="Supertrend 1", color=color.green)
plot(supertrend2_value, title="Supertrend 2", color=color.blue)
plot(supertrend3_value, title="Supertrend 3", color=color.red)
plot(ema, title="EMA", color=color.orange)

// Plot strategy entry signals
plotshape(series=longCondition, title="Long Entry Signal", location=location.belowbar, color=color.green, style=shape.triangleup, size=size.small)
plotshape(series=shortCondition,title="Short Entry Signal", location=location.abovebar,color=color.red ,style=shape.triangledown,size=size.small)