カスタム非再描画 HTF MACD MFI スケーラブル ロボット戦略
概要
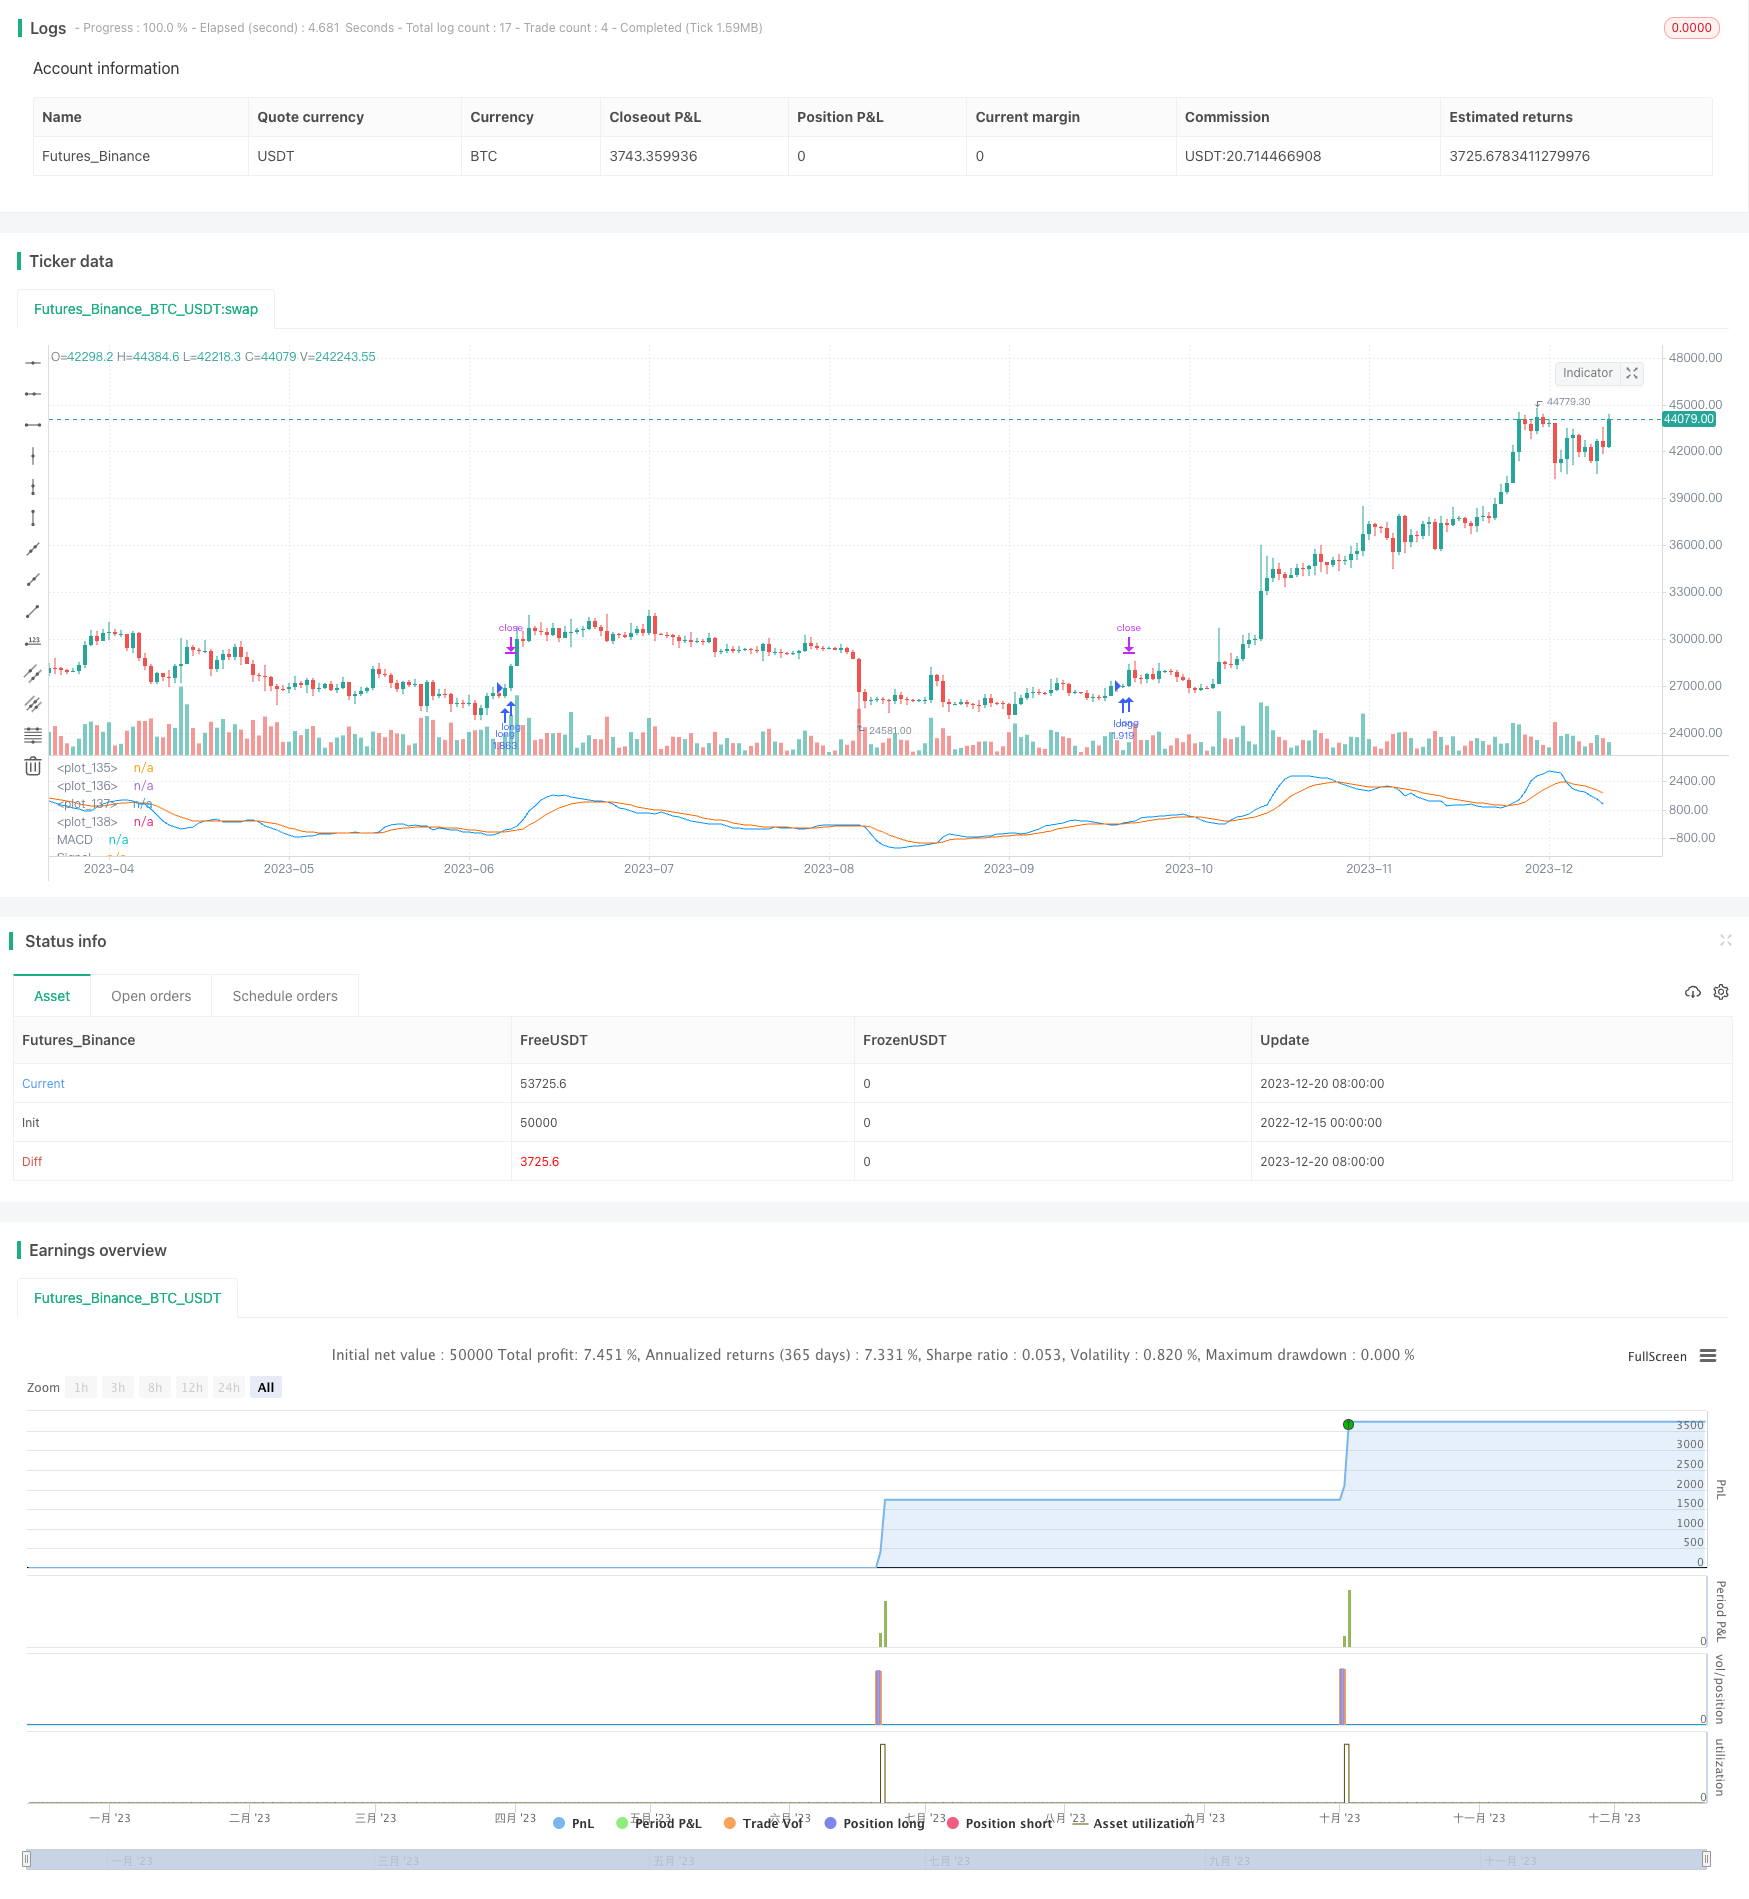
この戦略は,高度にカスタマイズ可能な,MACDとMFIの指標を重複しない組み合わせ戦略であり,アルゴリズム化された取引ロボットに適用されます.これは,トレンドインジケーターとモナティズムインジケーターを組み合わせて,複数のフィルターで取引信号を生成します.
戦略原則
この戦略は,市場トレンドの方向を判断するためにMACD指標を使用する.MACDは,トレンドを追跡する動量指標であり,急速な移動平均線を減算して遅い移動平均線からMACD柱状のグラフが得られ,MACDの指数移動平均線から信号線が得られます.快線で線をゆっくりと穿越すると買入信号で,下を穿越すると売出信号になります.
さらに,この戦略は,MFI指標を使用して市場の超買超売状態を判断する.MFI指標は価格と取引量情報を組み合わせ,値が0から100の間で波動する.MFIは20を下回ると超売地域であり,80を超えると超買地域である.
偽信号をフィルターするために,この戦略にはトレンドフィルターとRSIフィルターも追加されています. 価格が上昇傾向にあり,RSIが値設定より小さい場合,買取シグナルが生じます.
戦略的優位性
- 複数の指標を組み合わせて,市場状況を総合的に判断し,勝利率を上げる
- フィルターメカニズムを導入し,偽信号を回避し,不必要な取引を減らす
- 各種パラメータとフィルターは,異なる品種と取引の好みに合わせてカスタマイズできます
- 手動取引にも使用できるし,アルゴリズムロボットに接続してプログラム化された取引を行う.
戦略的リスクと解決策
指数パラメータの設定が不適切で,偽信号が生じやすい
異なるパラメータをテストし,最適なパラメータの組み合わせを選択できます.
多品種パラメータは一般的ではなく,別々にテストして最適化する必要があります.
取引頻度が高くなり,取引コストと滑り込みリスクが増加する
調整可能なフィルターで取引の頻度を下げる
リアルタイムで取引する際のコスト管理
戦略最適化の方向性
- より長いデータサイクルをテストし,パラメータの安定性を評価する
- 異なる指数関数組み合わせを試す
- 戦略の安定性を高めるための指標の最適化
- フィルターを増やして不必要な取引を減らす
要約する
この戦略は,高度にカスタマイズ可能なトレンド追跡型の戦略であり,同時にトレンドと動態指標を組み合わせて市場の状態を判断し,フィルターメカニズムを利用してリスクを効果的に制御する.これは,手動取引に使用され,また,アルゴリズムロボットを接続して高度に自動化されたプログラム取引を実現し,長期的に追跡する価値のある最適化戦略体系である.
/*backtest
start: 2022-12-15 00:00:00
end: 2023-12-21 00:00:00
period: 1d
basePeriod: 1h
exchanges: [{"eid":"Futures_Binance","currency":"BTC_USDT"}]
*/

//(c) Wunderbit Trading
//Modified by Mauricio Zuniga - Trade at your own risk
//This script was originally shared on Wunderbit website as a free open source script for the community. (https://help.wundertrading.com/en/articles/5246468-macd-mfi-trading-bot-for-ftx)
//
//WHAT THIS SCRIPT DOES:
//   This is a scalping script originally intended to be used on altorightmic bot trading.
//   This strategy is based on the trend-following momentum indicator. It includes the Money Flow index as an additional point for entry.
//HOW IT DOES IT:
//   It uses a combination of MACD and MFI indicators to create entry signals.  Parameters for each indicator have been surfaced for user configurability.
//   Take profits are fixed, but stop loss uses ATR configuration to minimize losses and close profitably.
//HOW IS MY VERSION ORIGINAL:
//   I started trying to deploy this script myself in my algorithmic tradingg but ran into some issues which I have tried to address in this version.
//   Delayed Signals : The script has been refactored to use a time frame drop down.  The higher time frame can be run on a faster chart (recommended on one minute chart for fastest signal confirmation and relay to algotrading platform.
//   Repainting Issues : All indicators have been recoded to use the security function that checks to see if the current calculation is in realtime, if it is, then it uses the previous bar for calculation.
//   If you are still experiencing repainting issues based on intended (or non intended use), please provide a report with screenshot and explanation so I can try to address.
//   Filtering :  I have added to additional filters an ABOVE EMA Filter and a BELOW RSI Filter (both can be turned on and off)
//   Customizable Long and Clos Messages : This allows someone to use the script for algorithmic trading without having to alter code.  It also means you can use one indicator for all of your different alterts required for your bots.
//HOW TO USE IT:
//   Find a pair with high volatility - I have found it works particularly well with 3L and 3S tokens for crypto. although it the limitation is that confrigurations I have found to work typically have low R/R ratio, but very high win rate and profit factor.
//   Ieally set one minute chart for bots, but you can use other charts for manual trading.  The signal will be delayed by one bar but I have found configurations that still test well.
//   Select a time frame in configuration for your indicator calculations.
//   I like ot use 5 and 15 minutes for scalping scenarios, but I am interested in hearing back from other community memebers.
//   Optimize your indicator without filters (trendFilter and RSI Filter)
//   Use the TrendFilter and RSI Filter to further refine your signals for entry.

//@version=4
strategy("Customizable HTF MACD Strategy v1.2", overlay=false, pyramiding=0, commission_type=strategy.commission.percent, commission_value=0.07, default_qty_type = strategy.percent_of_equity, default_qty_value = 100, currency = currency.USD)

openlongcomment = "Comment In Here"
closelongcomment = ""
openshortcomment = ""
closeshortcommment = ""
//RES
res = input(title="Resolution", type=input.resolution, defval="5", group="Strategy", inline="1")
comment = input(title="Open Long Comment", type=input.string, defval="",group="Strategy", inline="1")

if not(comment == "")
    openlongcomment := comment
// FUNCTIONS

Ema(src,p) =>
    ema = 0.
    sf = 2/(p+1)
    ema := nz(ema[1] + sf*(src - ema[1]),src)

Sma(src,p) => a = cum(src), (a - a[max(p,0)])/max(p,0)

Atr(p, res) =>
    atr = 0.
    highHTF = security(syminfo.tickerid, res, high[barstate.isrealtime ? 1 : 0])
    lowHTF = security(syminfo.tickerid, res, low[barstate.isrealtime ? 1 : 0])
    closeHTF = security(syminfo.tickerid, res, close[barstate.isrealtime ? 1 : 0])
    Tr = max(highHTF - lowHTF, max(abs(highHTF - closeHTF[1]), abs(lowHTF - closeHTF[1])))
    atr := nz(atr[1] + (Tr - atr[1])/p,Tr)


ribbon_period = input(39, "Period", step=1)

htfClose = security(syminfo.tickerid, res, close[barstate.isrealtime ? 1 : 0])

leadLine1 = ema(htfClose, ribbon_period)
leadLine2 = sma(htfClose, ribbon_period)

// p3 = plot(leadLine1, color= #53b987, title="EMA", transp = 50, linewidth = 1)
// p4 = plot(leadLine2, color= #eb4d5c, title="SMA", transp = 50, linewidth = 1)
// fill(p3, p4, transp = 60, color = leadLine1 > leadLine2 ? #53b987 : #eb4d5c)

//Upward Trend
UT=leadLine2 < leadLine1
DT=leadLine2>leadLine1
//FILTER LOGIC
aboveTrend = input(true, title="Use Trend", group="Filters", inline='1', type=input.bool)
TrendLength  = input(3, minval=1, title="Trend MA", group="Filters", inline='1', type=input.integer)
aboveTrendFilter = sma(htfClose,TrendLength)

useRSI = input(true, title="Use RSI", group="Filters", inline='2', type=input.bool)
RSILength  = input(34, minval=1, title="RSI Length", group="Filters", inline='2') // used to calculate RSI
belowRSIFilter  = input(50, minval=1, title="Buy Below RSI Filter", group="Filters", inline='2') // only buy if its below this RSI - doesn't seem to work as expected
rsi = rsi(htfClose,RSILength)

if not(useRSI)
    belowRSIFilter = 100
if not(aboveTrend)
    aboveTrendFilter = -1


// MACD
fast_length = input(title="Fast Length", type=input.integer, defval=7)
slow_length = input(title="Slow Length", type=input.integer, defval=23)
src = input(title="Source", type=input.source, defval=close)
signal_length = input(title="Signal Smoothing", type=input.integer, minval = 1, maxval = 50, defval = 10)
sma_source = input(title="Simple MA(Oscillator)", type=input.bool, defval=false)
sma_signal = input(title="Simple MA(Signal Line)", type=input.bool, defval=false)

// Plot colors
col_grow_above = #26A69A
col_grow_below = #FFCDD2
col_fall_above = #B2DFDB
col_fall_below = #EF5350
col_macd = #0094ff
col_signal = #ff6a00


srcHTF = security(syminfo.tickerid, res, src[barstate.isrealtime ? 1 : 0])
// Calculating
fast_ma = sma_source ? Sma(srcHTF, fast_length) : Ema(srcHTF, fast_length)
slow_ma = sma_source ? Sma(srcHTF, slow_length) : Ema(srcHTF, slow_length)

macd = fast_ma - slow_ma
signal = sma_signal ? Sma(macd, signal_length) : Ema(macd, signal_length)
hist = macd - signal

//plot(hist, title="Histogram", style=plot.style_columns, color=(hist>=0 ? (hist[1] < hist ? col_grow_above : col_fall_above) : (hist[1] < hist ? col_grow_below : col_fall_below) ), transp=0 )
plot(macd, title="MACD", color=col_macd, transp=0)
plot(signal, title="Signal", color=col_signal, transp=0)

/// MFI

MFIsource = hlc3
sourceHTF = security(syminfo.tickerid, res, MFIsource[barstate.isrealtime ? 1 : 0])
length = input(15, minval=1)
lower = input(12, minval=0, maxval=50)
upper = input(80, minval=50, maxval=100)

// DrawMFI_f=input(true, title="Draw MFI?", type=bool)
HighlightBreaches=input(true, title="Highlight Oversold/Overbought?")

volumeHTF = security(syminfo.tickerid, res, volume[barstate.isrealtime ? 1 : 0])

// MFI
upper_s = sum(volumeHTF * (change(sourceHTF) <= 0 ? 0 : sourceHTF), length)
lower_s = sum(volumeHTF * (change(sourceHTF) >= 0 ? 0 : sourceHTF), length)
mf = rsi(upper_s, lower_s)
mfp = plot(mf, color=color.new(color.gray,0), linewidth=1)
top = hline(upper, color=color.new(color.gray, 100), linewidth=1, editable=false)
bottom = hline(lower, color=color.new(color.gray,100), linewidth=1, editable=false)
hline(0, color=color.new(color.black,100), editable=false)
hline(100, color=color.new(color.black,100), editable=false)

// Breaches
b_color = (mf > upper) ? color.new(color.red,70) : (mf < lower) ? color.new(color.green,60) : na
bgcolor(HighlightBreaches ? b_color : na)

fill(top, bottom, color=color.gray, transp=75)

// TAKE PROFIT AND STOP LOSS
long_tp1_inp = input(1, title='Long Take Profit 1 %', step=0.1)/100
long_tp1_qty = input(20, title="Long Take Profit 1 Qty", step=1)

long_trailing = input(1.3, title='Trailing Stop Long', step=0.1) / 100

long_take_level_1 = strategy.position_avg_price * (1 + long_tp1_inp)

// Stop Loss
multiplier = input(2, "SL Mutiplier", minval=1, step=0.1)
ATR_period=input(40,"ATR period", minval=1, step=1)

// Strategy
entry_long=(crossover(macd,signal) or (crossover(mf,lower) and leadLine2 < leadLine1)) and rsi < belowRSIFilter and close > aboveTrendFilter
entry_price_long=valuewhen(entry_long,close,0)
//SL_floating_long = entry_price_long -( (entry_price_long)*multiplier/100)//*Atr(ATR_period,res)
//SL_floating_long = entry_price_long - multiplier*Atr(ATR_period,res)
SL_floating_long = entry_price_long - multiplier*Atr(ATR_period,res)
exit_long= close < SL_floating_long

///// BACKTEST PERIOD ///////
testStartYear = input(2018, "Backtest Start Year")
testStartMonth = input(1, "Backtest Start Month")
testStartDay = input(1, "Backtest Start Day")
testPeriodStart = timestamp(testStartYear, testStartMonth, testStartDay, 0, 0)

testStopYear = input(9999, "Backtest Stop Year")
testStopMonth = input(12, "Backtest Stop Month")
testStopDay = input(31, "Backtest Stop Day")
testPeriodStop = timestamp(testStopYear, testStopMonth, testStopDay, 0, 0)

testPeriod() =>
    time >= testPeriodStart and time <= testPeriodStop ? true : false

if testPeriod()
    if UT
        strategy.entry("long", strategy.long, when=entry_long == true, comment=openlongcomment)
    strategy.exit("TP1","long", qty_percent=long_tp1_qty, limit=long_take_level_1)
    strategy.exit("Trail stop","long",  comment=closelongcomment,  trail_points=entry_price_long * long_trailing / syminfo.mintick, trail_offset=entry_price_long * long_trailing / syminfo.mintick)
    strategy.close("long", exit_long == true,  comment=closelongcomment )