オシレーター指数変換戦略
作成日:
2023-12-22 14:21:28
最終変更日:
2023-12-22 14:21:28
コピー:
0
クリック数:
772
1
フォロー
1750
フォロワー
概要
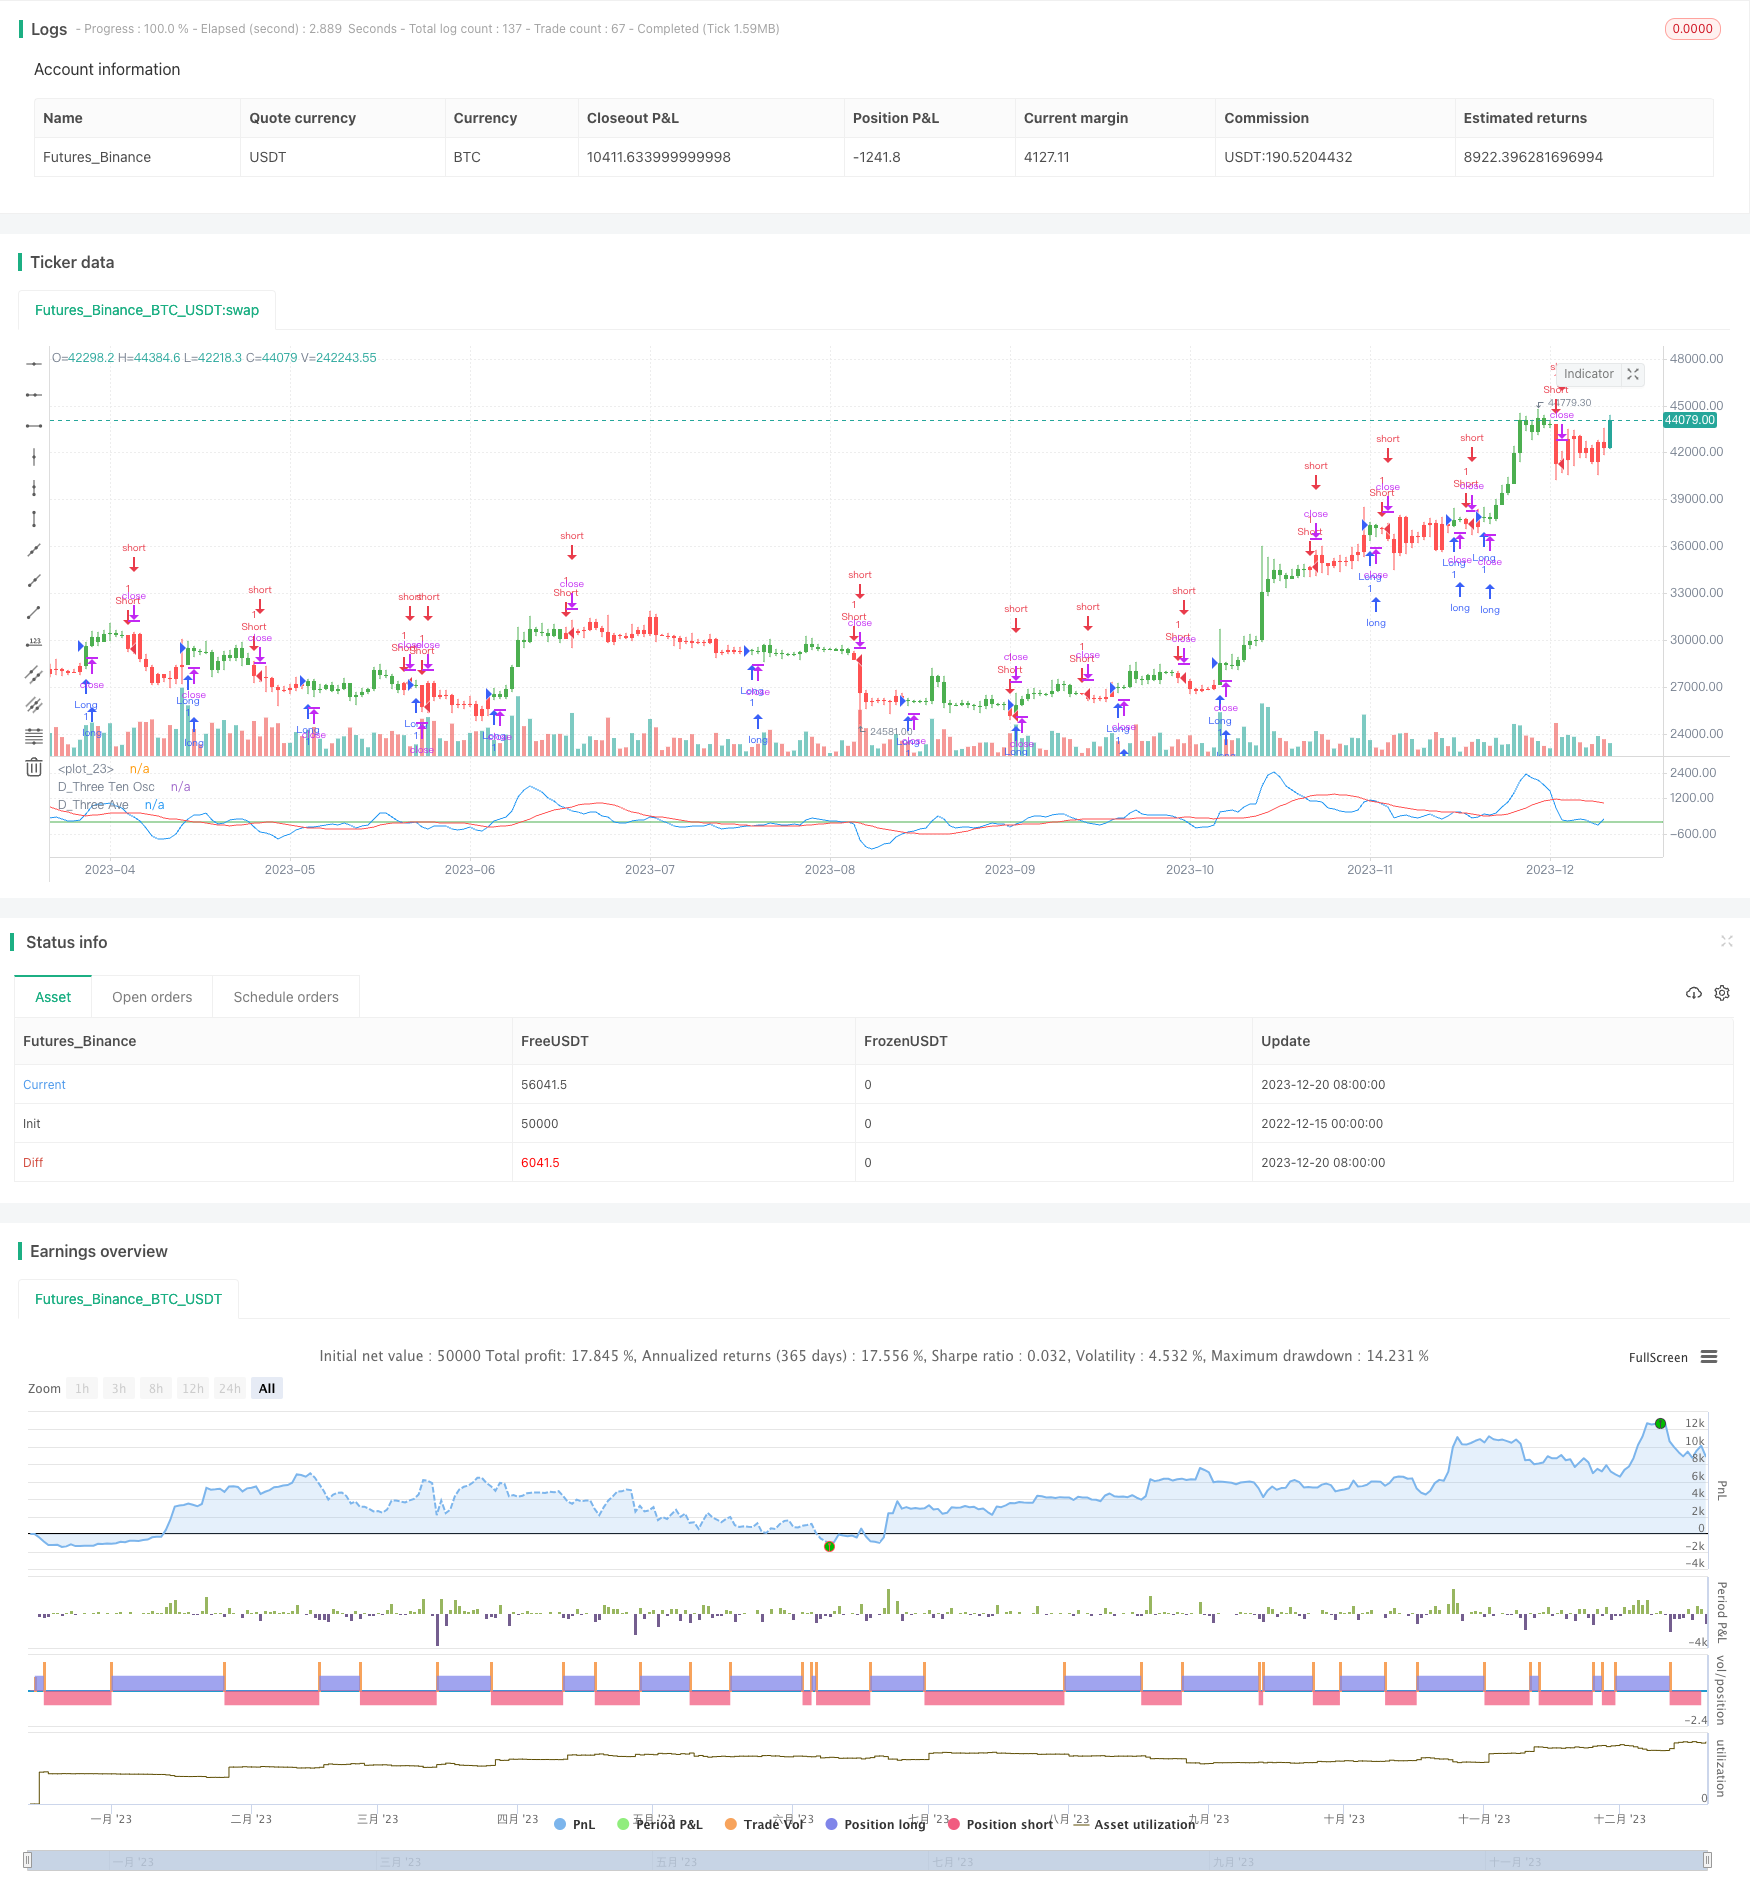
振動指数変換戦略は,ブレセートの3-10振動指数とその16日間の簡易移動平均との交差を活用して取引信号を生成する.この戦略は,昼間および夜間取引に適用される.
戦略原則
この戦略は,ブレセットの3-10振動指数に基づいている.この指数は,3日指数移動平均と10日指数移動平均の差値である.快線 (<3-10振動指数>) の上に慢線 (<16日簡易移動平均>) を渡るときは多し,快線の下の慢線を渡るときは空にする.
具体的には,3日EMA,10日EMAとその差値を振動指数として計算する.それから16日振動指数の単純移動平均を信号線として計算する.振動指数の上を通るときは多し,下を通るときは空にする.逆転が許される.
優位分析
- クラシックなブレスレット振動指数を使って,
- スローラインの交差を組み合わせて取引シグナルを形成し,エントリーとエグジットを容易に判断する.
- 市場環境の変化に適応する反転的なアプローチが許される
- 昼間および夜間取引に使用できる
リスク分析
- ブレスレット振動指数の効果は不安定で,一定利益の変動がある.
- 速線と遅線交差信号は偽信号が発生する可能性があります.
- 逆転はリスクが高いので慎重に行う必要があります.
- 昼間の取引は,ストップ・ロスの戦略を考慮し,夜間の取引は,資金管理を考慮する.
最適化の方向
- パラメータを最適化し,移動平均周期を調整し,最適なパラメータの組み合わせを見つける
- フィルタリング条件を追加し,他の指標または価格形状と組み合わせて信号の質を判断する
- ストップ・ストップ戦略を増やし,合理的なストップ・ポイントを設定し,単発損失を制御する.
- 資金管理を最適化し,ポジションのサイズを調整し,単一の損失が総資金に与える影響を軽減する
要約する
振動指数変数戦略は,短線取引戦略の1つであり,ブレセットの3-10振動指数とその信号線の交差によって取引信号を生成する.シンプルで実用的である.この戦略は,昼間と夜間取引に適用できるが,一定の損益波動と偽信号のリスクがあり,フィルタリング条件の最適化やストップダスの改善が必要である.この戦略は,パラメータの最適化と資金管理が適切であれば,一定の余分な利益を得ることができる.
ストラテジーソースコード
/*backtest
start: 2022-12-15 00:00:00
end: 2023-12-21 00:00:00
period: 1d
basePeriod: 1h
exchanges: [{"eid":"Futures_Binance","currency":"BTC_USDT"}]
*/

//@version=2
////////////////////////////////////////////////////////////
//  Copyright by HPotter v1.0 27/03/2017
// TradeStation does not allow the user to make a Multi Data Chart with
// a Tick Bar Chart and any other type a chart. This indicator allows the
// user to plot a daily 3-10 Oscillator on a Tick Bar Chart or any intraday interval.
// Walter Bressert's 3-10 Oscillator is a detrending oscillator derived
// from subtracting a 10 day moving average from a 3 day moving average.
// The second plot is an 16 day simple moving average of the 3-10 Oscillator.
// The 16 period moving average is the slow line and the 3/10 oscillator is
// the fast line.
// For more information on the 3-10 Oscillator see Walter Bressert's book
// "The Power of Oscillator/Cycle Combinations"
//
// You can change long to short in the Input Settings
// Please, use it only for learning or paper trading. Do not for real trading.
////////////////////////////////////////////////////////////
strategy(title="D_Three Ten Osc", shorttitle="D_Three Ten Osc")
Length1 = input(3, minval=1)
Length2 = input(10, minval=1)
Length3 = input(16, minval=1)
reverse = input(false, title="Trade reverse")
hline(0, color=green, linestyle=line)
xPrice =  request.security(syminfo.tickerid,"D", hl2)
xfastMA = ema(xPrice, Length1)
xslowMA = ema(xPrice, Length2)
xMACD = xfastMA - xslowMA
xSignal = sma(xMACD, Length3)
pos = iff(xSignal > xMACD, -1,
	     iff(xSignal < xMACD, 1, nz(pos[1], 0)))
possig = iff(reverse and pos == 1, -1,
          iff(reverse and pos == -1, 1, pos))
if (possig == 1)
    strategy.entry("Long", strategy.long)
if (possig == -1)
    strategy.entry("Short", strategy.short)
barcolor(possig == -1 ? red: possig == 1 ? green : blue )
plot(request.security(syminfo.tickerid, "D", xMACD), color=blue, title="D_Three Ten Osc")
plot(request.security(syminfo.tickerid, "D", xSignal), color=red, title="D_Three Ave")