感情に基づくXBT先物取引戦略
概要
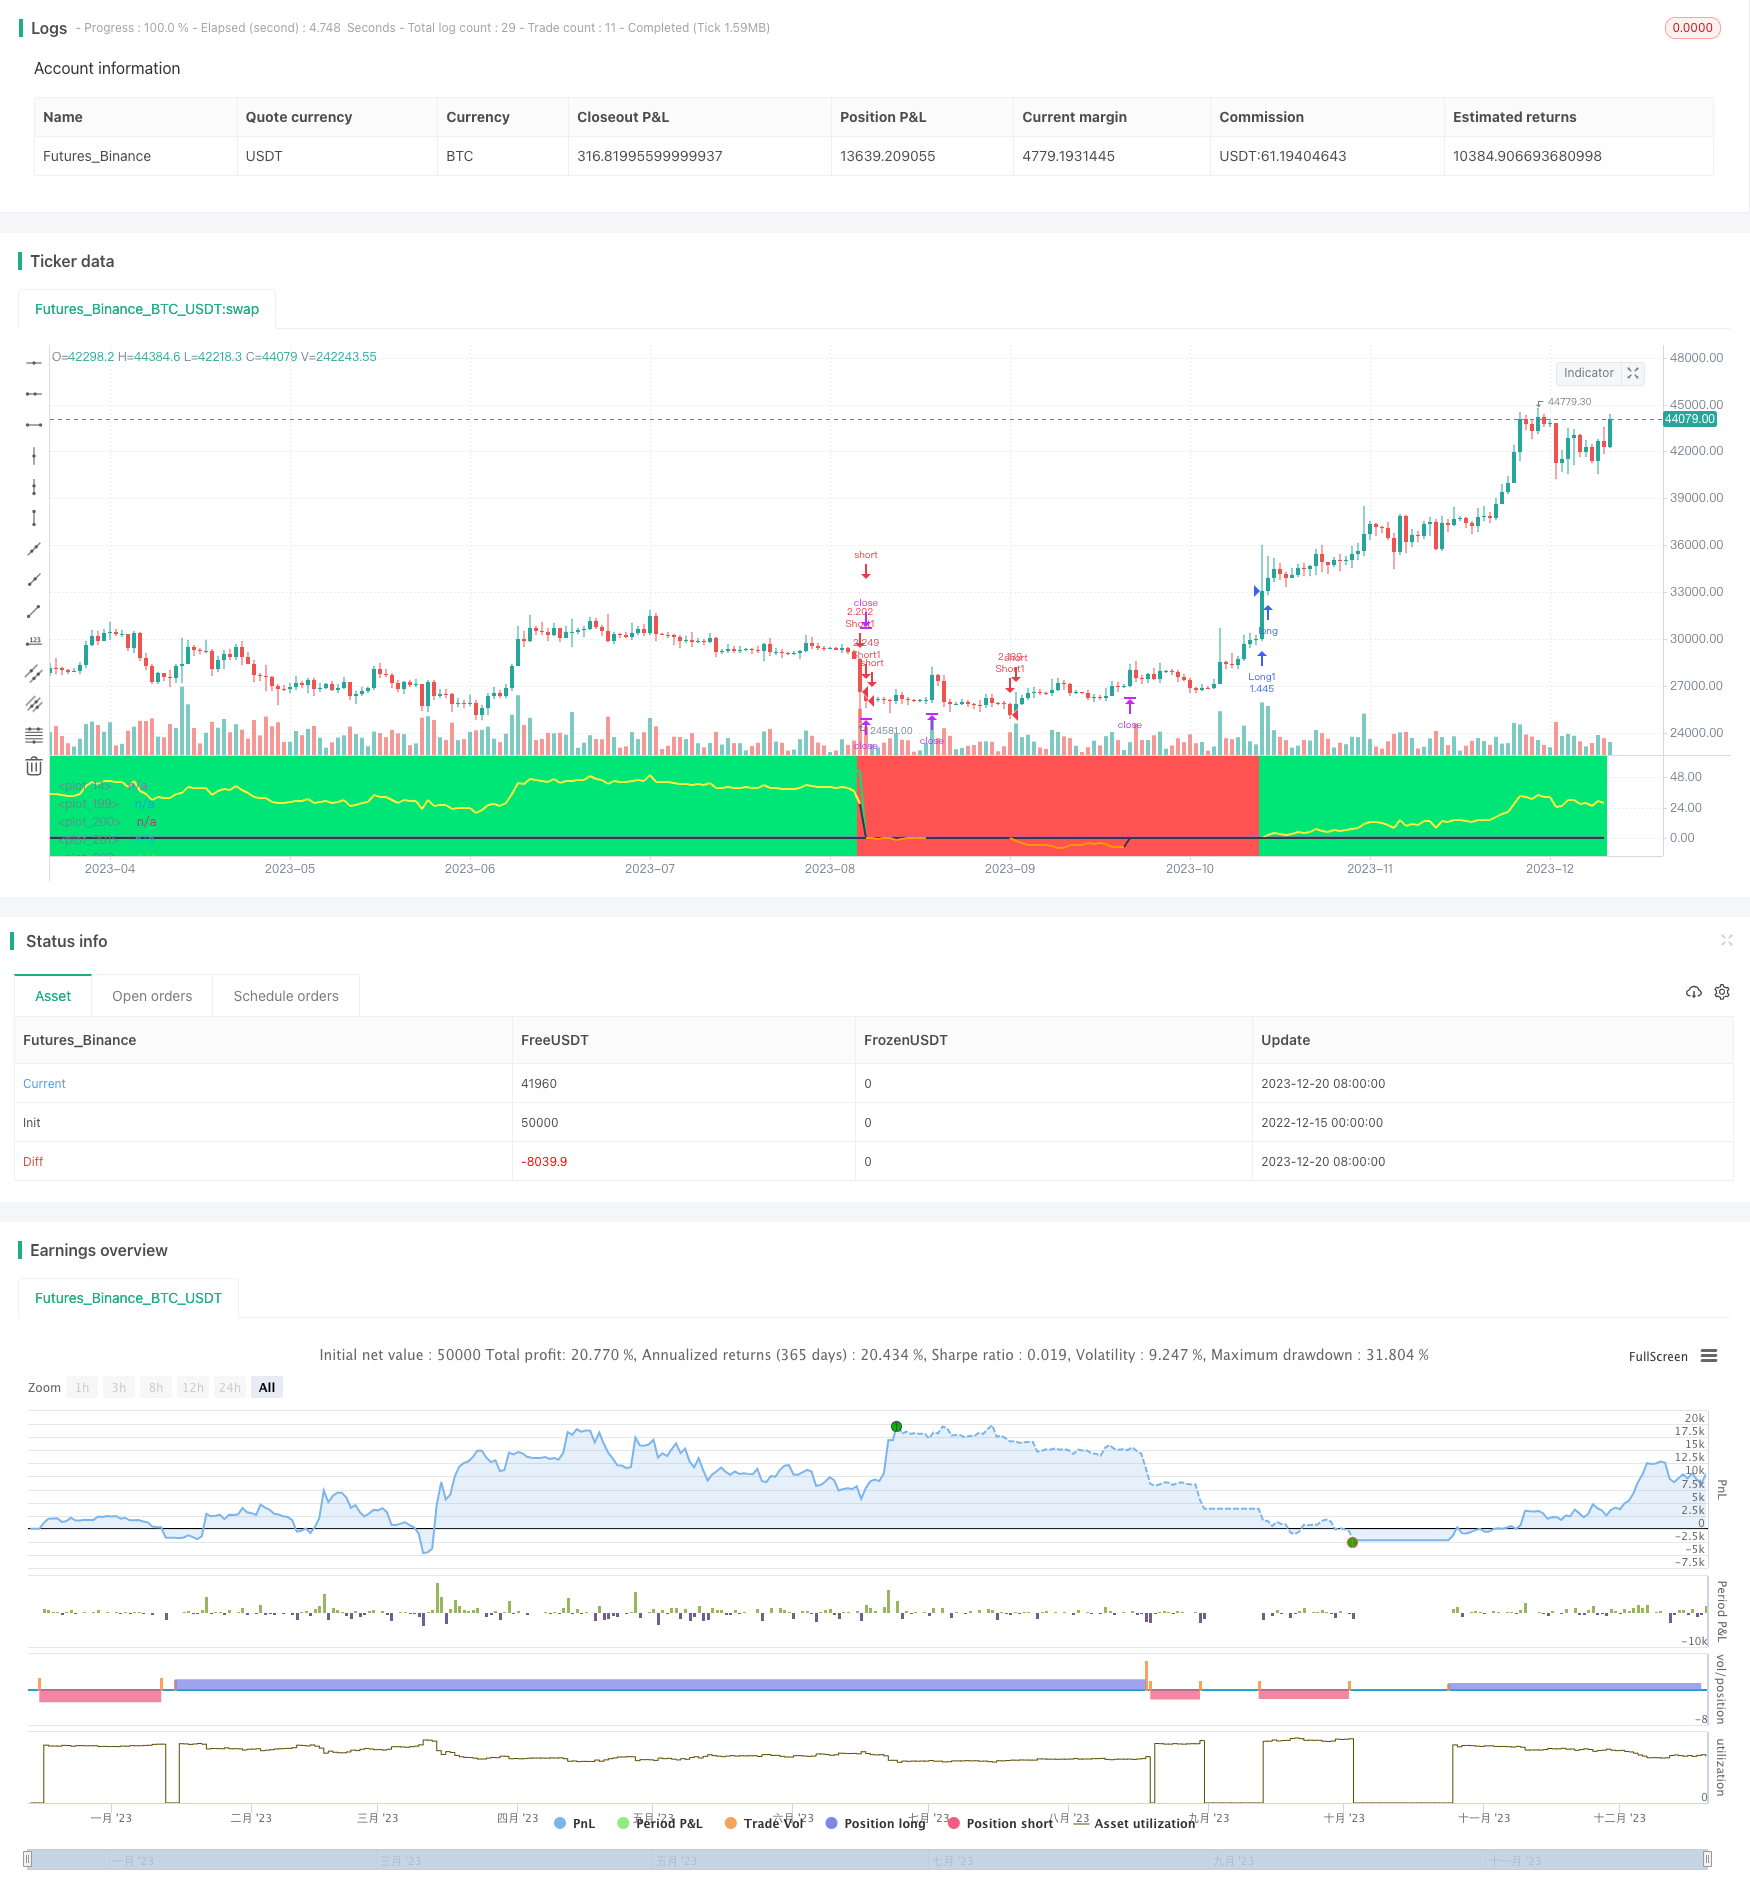
この戦略は,多周期的情動分析の方法を採用し,XBTUSD契約の多空取引を行う. それは,異なる周期における価格変動幅と最高価格,最低価格の情報を総合的に考慮し,一連の重量調整により,現在の市場の全体的な情動値を計算する.情動値の変化法則に基づいて状況を判断し,買入と売却の信号を生成する.
戦略原則
a から j の周期 ((1 から 89 根の K 線) 内の最高価格,最低価格,平均価格,価格変動幅などの指標を計算する.
価格の範囲内の現在の閉店価格の標準化された位置を定義し,各周期の価格変動幅を組み合わせて,異なる周期における感情値を計算する.
感情値は,一連の重量 (w変数) を調整して,全体的な感情値 (sentiment) を計算する.感情値は,現在の市場の平均的な感情を反映する.
感情の値の変動を分析し,感情が正から負に転じると,売り込みシグナルを生じ;感情が負から正に転じると,買い込みシグナルを生じ.
感情の絶対波動値の大きさ ((デルタ変数),入場力の判断,および停止停止条件の設定.
戦略的優位性
市場動向をより全面的に判断するために,さまざまな時間帯の感情を考慮します.
戦略の安定性を高めるための重量調整メカニズム
感情値と感情の変動を総合的に考慮して,入学時間をより正確に判断する.
最低価格と最高価格の組み合わせで,ストップ・ストップ・メカニズムによるリスクコントロール.
戦略リスク
パラメータを正しく設定しない場合,取引が頻発し,取引機会が失われる可能性があります.
突発的な黒天事件は,戦略の失敗につながる可能性がある.
契約の調整,取引規則の変更など,戦略に影響を与える可能性があります.
感情値の計算は歴史的データに依存し,市場構造の変化に応じて再評価と調整が必要である.
重量,取引周期,ストップ・ストラスト幅などのパラメータを調整することで最適化することができ,市場構造の変化に戦略をより適応させることができる.同時に,資金管理を最適化し,単一の取引規模と全体的なポジションを厳格に制御する.
最適化の方向
感情的な判断の基礎を豊かにする分析サイクルを拡大し続けること.
感情判断と技術指標の組み合わせを可能にする技術指標の追加
感情特性を抽出する機械学習の手法
動的に重み設定を調整する.
ストップ・ストップ・ロスの戦略を最適化する.
要約する
この戦略は,感情分析の取引理念を基礎として,多周期総合的考察によって,現在の全体的な市場情勢を判断する.その連続的な感情の変化が取引信号を生成する根拠として,価格変動情報によって特定の入場タイミングを判断する.この戦略は,状況の判断の視点が独特で,大周期の揺れ動いている状況で良好なパフォーマンスを発揮する.周期設定をさらに拡張し,より多くの補助技術指標を追加し,パラメータ最適化を調整するなど,この感情取引戦略をより成熟し,安定させ,より複雑な市場環境に適応させることができる.
/*backtest
start: 2022-12-15 00:00:00
end: 2023-12-21 00:00:00
period: 1d
basePeriod: 1h
exchanges: [{"eid":"Futures_Binance","currency":"BTC_USDT"}]
*/

// This source code is subject to the terms of the Mozilla Public License 2.0 at https://mozilla.org/MPL/2.0/
// © Jomy

//@version=4

//2h chart BITMEX:XBTUSD
//use on low leverage 1-2x only

strategy("expected range STRATEGY",overlay=false,initial_capital=1000,precision=2)
leverage=input(1,"leverage",step=.5)
tp=input(53,"take profit %",step=1)
sl=input(7,"stoploss %",step=1)
stoploss=1-(sl/100)
plot(stoploss)
level=input(.70,"level to initiate trade",step=.02)
closelevel=input(0.0,"level to close trade",step=.02)
levelshort=input(.68,"level to initiate trade",step=.02)
closelevelshort=input(0.0,"level to close trade",step=.02)

wa=input(1.158,"weight a",step=.2)
wb=input(1.119,"weight b",step=.2)
wc=input(1.153,"weight c",step=.2)
wd=input(1.272,"weight d",step=.2)
we=input(1.295,"weight e",step=.2)
wf=input(1.523,"weight f",step=.2)
wg=input(1.588,"weight g",step=.2)
wh=input(2.100,"weight h",step=.2)
wi=input(1.816,"weight i",step=.2)
wj=input(2.832,"weight j",step=.2)
a=1
b=2
c=3
d=5
e=8
f=13
g=21
h=34
i=55
j=89

n=0
n:=if volume > -1
    nz(n[1])+1


ra=highest(high,a)-lowest(low,a)
aa=sma(ohlc4,a)
ha=aa[1]+ra[1]/2
la=aa[1]-ra[1]/2

rb=highest(high,b)-lowest(low,b)
ab=sma(ohlc4,b)
hb=ab[1]+rb[1]/2
lb=ab[1]-rb[1]/2

rc=highest(high,c)-lowest(low,c)
ac=sma(ohlc4,c)
hc=ac[1]+rc[1]/2
lc=ac[1]-rc[1]/2

rd=highest(high,d)-lowest(low,d)
ad=sma(ohlc4,d)
hd=ad[1]+rd[1]/2
ld=ad[1]-rd[1]/2

re=highest(high,e)-lowest(low,e)
ae=sma(ohlc4,e)
he=ae[1]+re[1]/2
le=ae[1]-re[1]/2

rf=highest(high,f)-lowest(low,f)
af=sma(ohlc4,f)
hf=af[1]+rf[1]/2
lf=af[1]-rf[1]/2

rg=highest(high,g)-lowest(low,g)
ag=sma(ohlc4,g)
hg=ag[1]+rg[1]/2
lg=ag[1]-rg[1]/2

rh=highest(high,h)-lowest(low,h)
ah=sma(ohlc4,h)
hh=ah[1]+rh[1]/2
lh=ah[1]-rh[1]/2

ri=highest(high,i)-lowest(low,i)
ai=sma(ohlc4,i)
hi=ai[1]+ri[1]/2
li=ai[1]-ri[1]/2

rj=highest(high,j)-lowest(low,j)
aj=sma(ohlc4,j)
hj=aj[1]+rj[1]/2
lj=aj[1]-rj[1]/2

placea=((close-la)/(ha-la)-.5)*-100
placeb=((close-lb)/(hb-lb)-.5)*-100
placec=((close-lc)/(hc-lc)-.5)*-100
placed=((close-ld)/(hd-ld)-.5)*-100
placee=((close-le)/(he-le)-.5)*-100
placef=((close-lf)/(hf-lf)-.5)*-100
placeg=((close-lg)/(hg-lg)-.5)*-100
placeh=((close-lh)/(hh-lh)-.5)*-100
placei=((close-li)/(hi-li)-.5)*-100
placej=((close-lj)/(hj-lj)-.5)*-100

sentiment=((placea/j)*ra*wa+(placeb/i)*rb*wb+(placec/h)*rc*wc+(placed/g)*rd*wd+(placee/f)*re*we+(placef/e)*rf*wf+(placeg/d)*rg*wg+(placeh/c)*rh*wh+(placei/b)*ri*wi+(placej/a)*rj*wj)/(wa+wb+wc+wd+we+wf+wg+wh+wi+wj)

deltalong=0.0
deltalong:=if sentiment>0
    nz(deltalong[1])+sentiment-sentiment[1]
else
    0
deltashort=0.0
deltashort:=if sentiment<0
    nz(deltashort[1])+((sentiment-sentiment[1])*-1)
else
    0

//plot(sentiment*-1,color=color.blue)
//plot(deltalong,color=color.red)
//plot(deltashort,color=color.lime)

peakfindlong=highest(deltalong,j)*level


peakfindshort=highest(deltashort,j)*levelshort


contracts=(strategy.equity/close)*leverage


//reason for o is this strategy makes dumb trades before the sentiment line crosses the 0 point the first time
o=0
o:=if cross(0,sentiment) and n>j
    1
else
    nz(o[1])

long=deltashort>peakfindlong and o==1

short=deltalong>peakfindshort and o==1


longstart=0.0
longstart:=if strategy.position_size>0 and strategy.position_size[1]<=0
    close
else
    nz(longstart[1])

shortstart=0.0
shortstart:=if strategy.position_size<0 and strategy.position_size[1]>=0
    close
else
    nz(shortstart[1])

highsincelong = 0.0
highsincelong := if strategy.position_size>0
    max(max(highsincelong[1],high),high[1])
else
    0

lowsinceshort = 1000000.0
lowsinceshort := if strategy.position_size<0
    min(min(lowsinceshort[1],low),low[1])
else
    10000000

closelong=strategy.position_size > 0 and ((highsincelong/longstart-1)*100) > tp
closeshort=strategy.position_size < 0 and ((shortstart/lowsinceshort-1)*100) > tp

stoptrade=0
stoptrade:= if closelong
    1
else
    nz(stoptrade[1])

stoptrade:= if short and stoptrade[1]==1
    0
else
    stoptrade

stoptrade:= if closeshort
    -1
else
    stoptrade

stoptrade:= if long and stoptrade[1]==-1
    0
else
    stoptrade

if(closelong)
    strategy.close("Long1")

pnllong = ((close - strategy.position_avg_price) / strategy.position_avg_price)*100
pnlshort = ((strategy.position_avg_price-close) / strategy.position_avg_price) *100
plot (strategy.position_size > 0 ?(highsincelong/longstart-1)*100 : 0.0,color=color.lime,linewidth=2)
plot (strategy.position_size < 0 ?(shortstart/lowsinceshort-1)*100 : 0.0,color=color.red,linewidth=2)
plot( strategy.position_size > 0 ? pnllong:0, color=strategy.position_size > 0 ?color.yellow:color.black,linewidth=2 )
plot( strategy.position_size < 0 ? pnlshort:0, color=strategy.position_size < 0 ?color.orange:color.black,linewidth=2)
longuntilshort=0
longuntilshort:=if long
    1
else
    if short
        -1
    else
        nz(longuntilshort[1])
bgcolor(stoptrade!=0?color.black:longuntilshort==1?color.lime:longuntilshort==-1?color.red:na,transp=70)

if(long and stoptrade==0)
    strategy.entry("Long1",strategy.long,qty=max(1,min(contracts,1000000000)))

if(closelong)
    strategy.close("Long1")

strategy.exit("Long1",stop=longstart * stoploss,when = strategy.position_size>0)

if(short and stoptrade==0)
    strategy.entry("Short1",strategy.short,max(1,min(contracts,1000000000)))

if(closeshort)
    strategy.close("Short1")

strategy.exit("Long1",stop=shortstart / stoploss,when = strategy.position_size<0)