スーパートレンド強化フラグファインダー
概要:この戦略は,順次突破旗形モデルと有名な超トレンド指標を巧妙に組み合わせて,ユニークな旗形識別方法を実現します.これは,従来の旗形を発見するだけでなく,超トレンド指標を使用してトレンドの方向と潜在的な停止位置を判断することができます.
戦略の原則:
- 旗形識別
- 動的に最高値と最低値を追跡し,フラッグアウトと整理区画を識別します.
- 整理区域の深さ/引き上げ幅,旗形長さが要求事項に適合するかどうかを,ユーザが設定したパラメータに基づいて判断する.
- 旗の形状が形成されたら,その色の線段で標識します.
- 超トレンド統合
- シンプルで効果的な超トレンド指標を適用し,チャート上のトレンドの動きをリアルタイムで表示します.
- 旗形の方向判断と組み合わせると,旗形の方向が正しいことを確認できます.
- また,超トレンドラインは取引の潜在的なストップポジションを提供します.
全体として,この旗形は超トレンドのゼロ-ラグと統合され,使いやすいトレンド追跡戦略を実現し,完全に融合し,旗形識別と超トレンドの止損を完璧に組み合わせます.
戦略的な利点:
伝統的技術分析とトレンドフォローを融合する この旗形と超トレンドの統合は,グラフィック認識と動力フォローを兼ね備えて,独特の混合戦略です.
潜在的ストップポジションを提供する 超トレンドは,取引ごとに明確なストップ・ロスを提供し,戦略のリスク管理に役立ちます.
使いやすい この戦略は,ユーザーが自分の取引の好みに合わせてカスタマイズできる一連の調整可能なパラメータを提供します. 操作はシンプルで,簡単に習得できます.
多空双方向取引を全面的に支持 この戦略は,看板と看板の両方をサポートし,あらゆる市場環境に適用され,非常に包括的なものです.
戦略的リスク:
旗の形が壊れた 旗形整理が設定パラメータを超えたり,元のトレンド方向に伸びると,旗形破損が発生し,誤信号が発生する.
超トレンド遅れの転換点を認識する 超トレンドラインには一定の遅滞があり,トレンドの転換点に大きな滑り点が起こる可能性があります.
パラメータ最適化 異なるパラメータの設定は,戦略のパフォーマンスに大きな影響を与える.最適化によって最適なパラメータの組み合わせを見つける必要があります.
取引方向偏差 単一取引のみを選択すると,戦略の適用範囲が制限されます.双方向取引を採用することが推奨されます.
戦略の最適化方向:
- 異なる超トレンドパラメータの組み合わせをテストし,最適なパラメータを見つけます.
- 旗形のパラメータを最適化し,旗形の識別をより正確かつ信頼性のあるものにする.
- 平均線やK線モデルなどの他の指標を組み合わせて,富の戦略を試みる.
- 戦略の安定性を高めるため,ストップ・ローズ戦略,ポジション管理などのモジュールを追加します.
結論から言うと この超トレンド強化旗形識別策は,旗形と超トレンドのミックスした独特のトレンド戦略である.これは,グラフィック認識の先導性と超トレンドの動力の追随のタイム効率を兼ね,従来の技術分析とデジタル定量化の完璧な組み合わせを実現している.使いやすい設定により,多種多様な取引品種に広く適用され,調整可能なパラメータは,トレーダーが自分の好みに従って個別化できるようにする.全体的に,これは,普遍的で,非常に実用的な旗形識別策である.
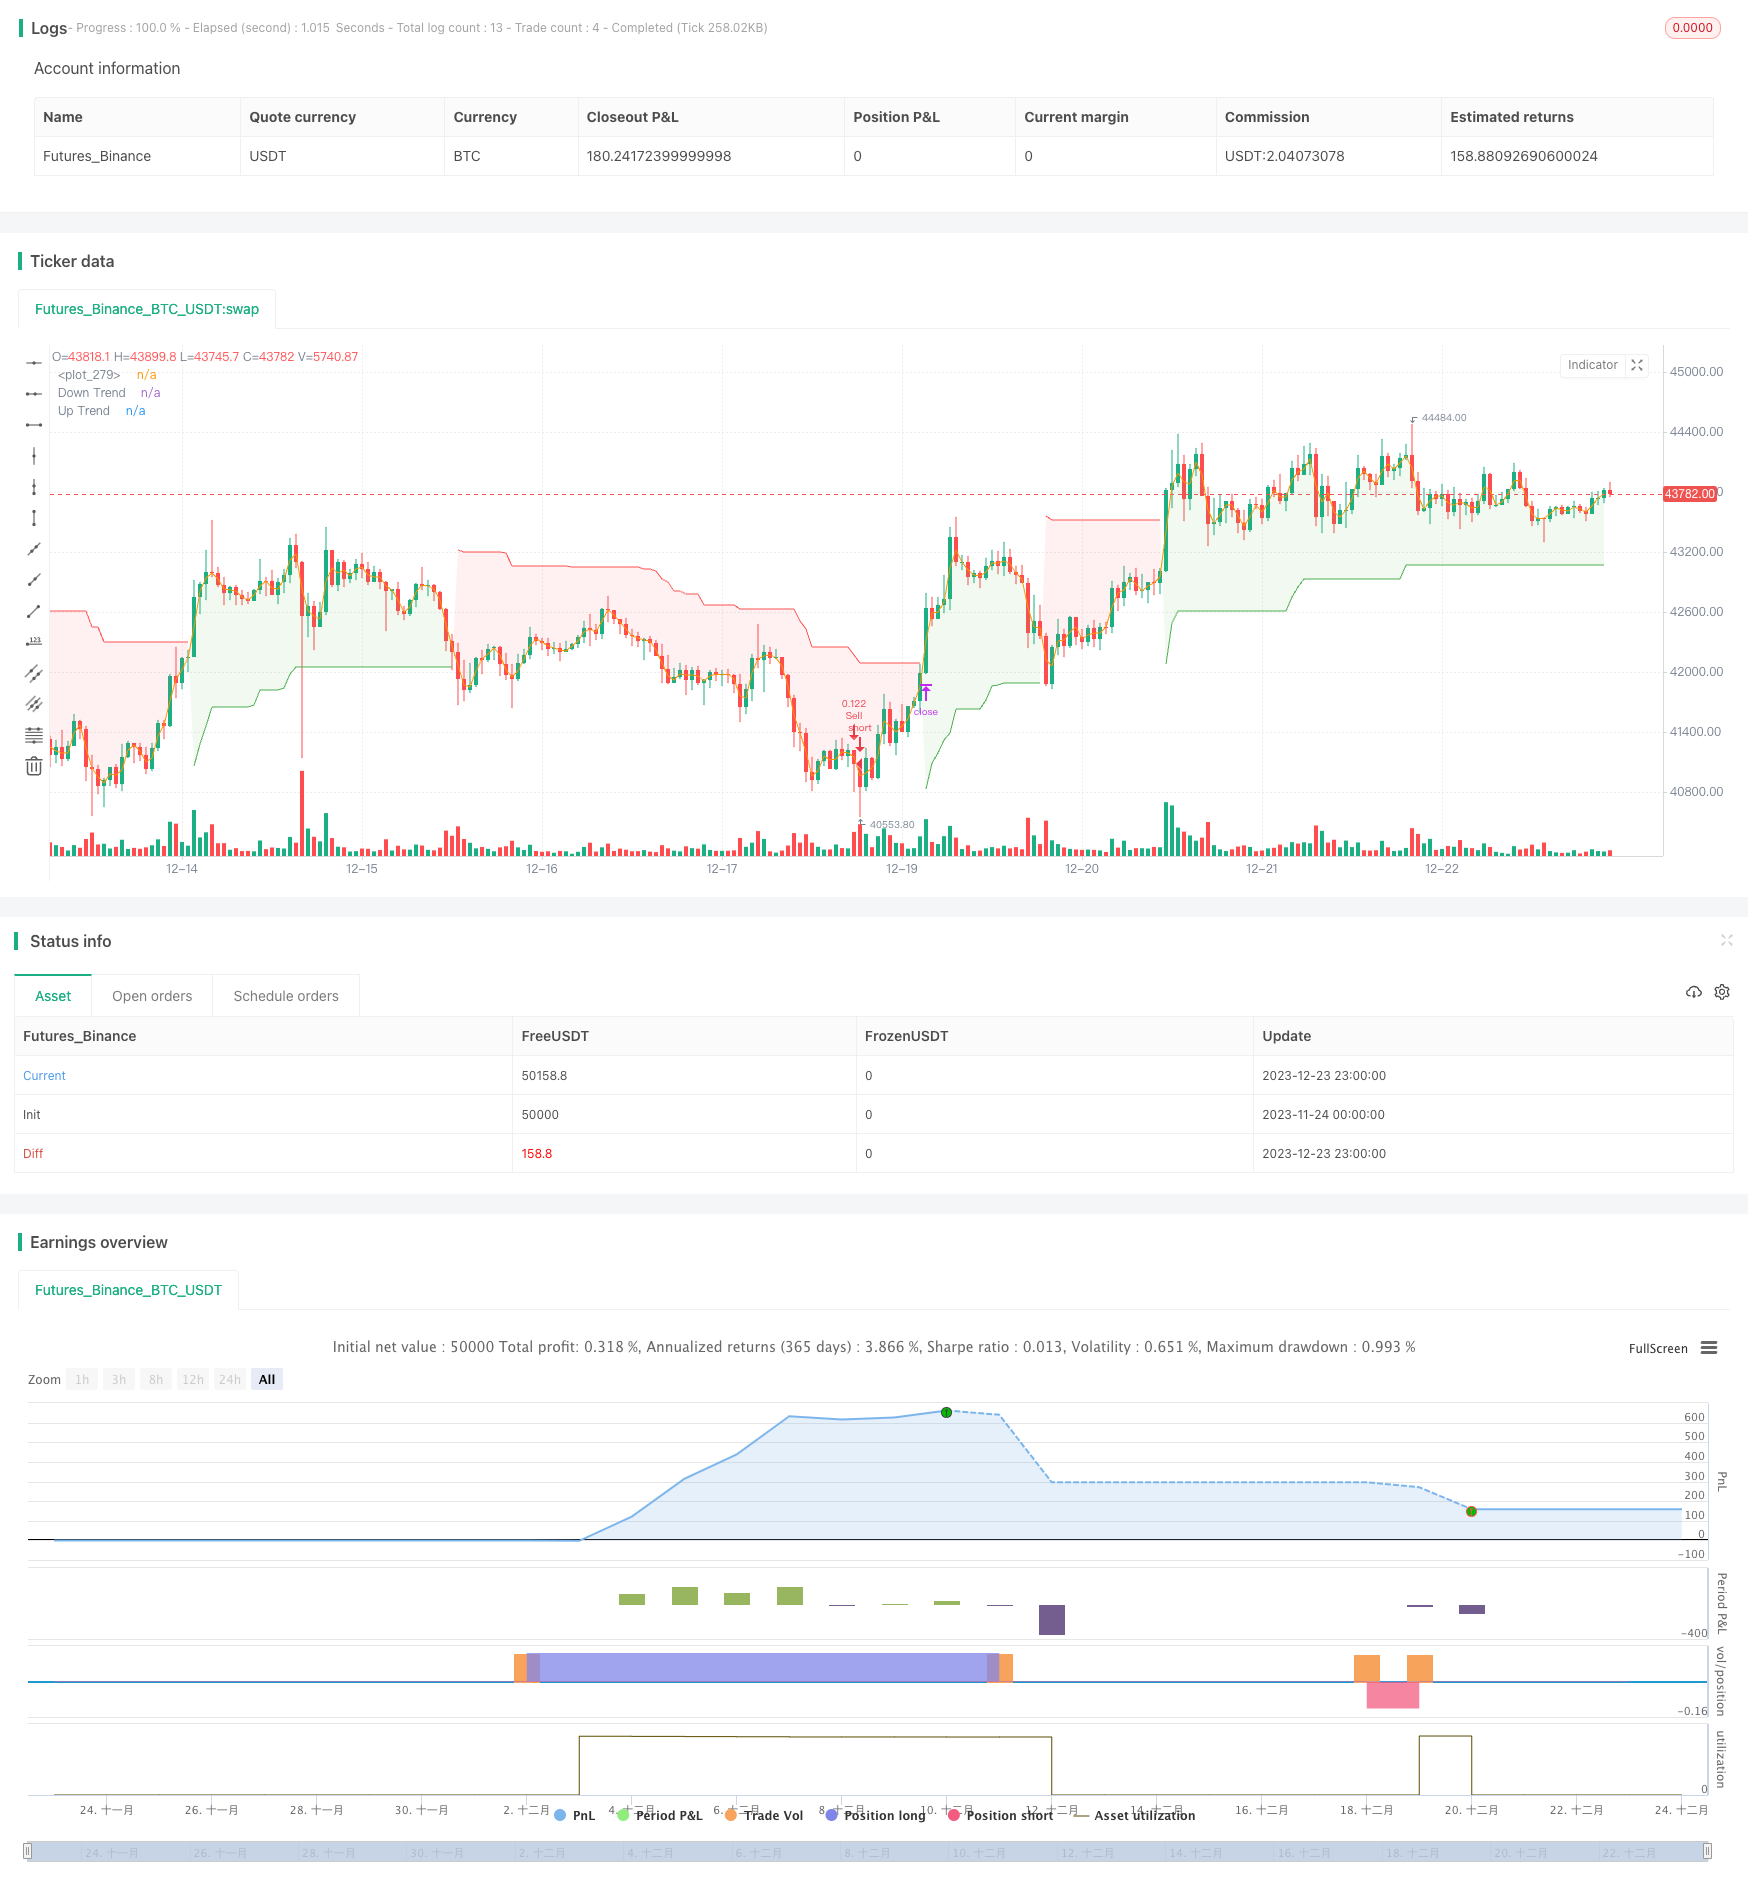
/*backtest
start: 2023-11-24 00:00:00
end: 2023-12-24 00:00:00
period: 1h
basePeriod: 15m
exchanges: [{"eid":"Futures_Binance","currency":"BTC_USDT"}]
*/

// This source code is subject to the terms of the Mozilla Public License 2.0 at https://mozilla.org/MPL/2.0/
// © Amphibiantrading

//@version=5
strategy("TrendGuard Flag Finder - Strategy [presentTrading]", overlay = true, precision=3, default_qty_type=strategy.cash,
 commission_value= 0.1, commission_type=strategy.commission.percent, slippage= 1,
  currency=currency.USD, default_qty_type = strategy.percent_of_equity, default_qty_value = 10, initial_capital= 10000)

//inputs
//user controlled settings for the indicator, separated into 4 different groups

// Add a button to choose the trading direction
tradingDirection = input.string("Both","Trading Direction", options=["Long", "Short", "Both"])

// Supertrend parameters
SupertrendPeriod = input(10, "Supertrend Length",group ='SuperTrend Criteria')
SupertrendFactor = input.float(4.0, "Supertrend Factor", step = 0.01,group ='SuperTrend Criteria')

// Flag parameters
var g1 = 'Bull Flag Criteria'

max_depth = input.float(5, 'Max Flag Depth', step = .25, minval = 2.0, group = g1, tooltip = 'Maximum pullback allowed from flag high to flag low')
max_flag = input.int(7, 'Max Flag Length', group = g1, tooltip = 'The maximum number of bars the flag can last')
min_flag = input.int(3, 'Min Flag Length', group = g1, tooltip = 'The minimum number of bars required for the flag')
poleMin = input.float(3.0, 'Prior Uptrend Minimum', group = g1, tooltip = 'The minimum percentage gain required before a flag forms')
poleMaxLen = input.int(13, 'Max Flag Pole Length', minval = 1, group = g1, tooltip = 'The maximum number of bars the flagpole can be')
poleMinLen = input.int(7, 'Min Flag Pole Length', minval = 1, group = g1, tooltip = 'The minimum number of bars required for the flag pole')

var g2 = 'Bear Flag Criteria'

max_rally = input.float(5, 'Max Flag Rally', step = .25, minval = 2.0, group = g2, tooltip = 'Maximum rally allowed from flag low to flag low')
max_flagBear = input.int(7, 'Max Flag Length', group = g2, tooltip = 'The maximum number of bars the flag can last')
min_flagBear = input.int(3, 'Min Flag Length', group = g2, tooltip = 'The minimum number of bars required for the flag')
poleMinBear = input.float(3.0, 'Prior Downtrend Minimum', group = g2, tooltip = 'The minimum percentage loss required before a flag forms')
poleMaxLenBear = input.int(13, 'Max Flag Pole Length', minval = 1, group = g2, tooltip = 'The maximum number of bars the flagpole can be')
poleMinLenBear = input.int(7, 'Min Flag Pole Length', minval = 1, group = g2, tooltip = 'The minimum number of bars required for the flag pole')

var g3 = 'Bull Flag Display Options'

showF = input.bool(true, 'Show Bull Flags', group = g3)
showBO = input.bool(true,'Show Bull Flag Breakouts', group = g3)
lineColor = input.color(color.green, 'Bull Line Color', group = g3)
lineWidth = input.int(2, 'Bull Line Width', minval = 1, maxval = 5, group = g3)

var g4 = 'Bear Flag Display Options'

showBF = input.bool(true, 'Show Bear Flags', group = g4)
showBD = input.bool(true,'Show Bear Flag Breakdowns', group = g4)
lineColorBear = input.color(color.red, 'Bear Flag Line Color', group = g4)
lineWidthBear = input.int(2, 'Bear Flag Line Width', minval = 1, maxval = 5, group = g4)


//variables
//declare starting variables used for identfying flags
var baseHigh = high, var startIndex = 0, var flagLength = 0, var baseLow = low
var lowIndex = 0, var flagBool = false, var poleLow = 0.0, var poleLowIndex = 0
var line flagHLine = na, var line flagLLine = na, var line flagPLine = na

// bear flag variables
var flagLowBear = high, var startIndexBear = 0, var flagLengthBear = 0, var flagHigh = low
var highIndex = 0, var flagBoolBear = false, var poleHigh = 0.0, var polehighIndex = 0
var line flagBearHLine = na, var line flagBearLLine = na, var line flagBearPLine = na

//find bull flag highs
// check to see if the current bars price is higher than the previous base high or na and then sets the variables needed for flag detection
if high > baseHigh or na(baseHigh)
    baseHigh := high
    startIndex := bar_index
    flagLength := 0
    baseLow := low
    lowIndex := bar_index
// check to see if the low of the current bar is lower than the base low, if it is set the base low to the low
if high <= baseHigh and low < baseLow
    baseLow := low
    lowIndex := bar_index
// moves the base low from the base high bar_index to prevent the high and low being the same bar
if high <= baseHigh and lowIndex == startIndex
    baseLow := low
    lowIndex := bar_index

//find bear flag lows
// check to see if the current bars price is lower than the previous flag low or na and then sets the variables needed for flag detection
if low < flagLowBear or na(flagLowBear)
    flagLowBear := low
    startIndexBear := bar_index
    flagLengthBear := 0
    flagHigh := high
    highIndex := bar_index
// check to see if the high of the current bar is higher than the flag high, if it is set the flag high to the high
if low >= flagLowBear and high > flagHigh
    flagHigh := high
    highIndex := bar_index
// moves the flag high from the flag low bar_index to prevent the high and low being the same bar
if low >= flagLowBear and highIndex == startIndexBear
    flagHigh := high
    highIndex := bar_index

//calulations bullish
findDepth = math.abs(((baseLow / baseHigh) - 1) * 100)  //calculate the depth of the flag
poleDepth = ((baseHigh / poleLow)- 1) * 100 // calculate the low of the flag pole to the base high
lower_close = close < close[1] // defines a lower close

//calculations bearish
findRally = math.abs(((flagHigh / flagLowBear) - 1) * 100)   //calculate the rally of the flag
poleDepthBear = ((flagLowBear / poleHigh)- 1) * 100 // calculate the high of the flag pole to the low high
higher_close = close > close[1] // defines a higher close

//start the counters
// begins starting bars once a high is less than the flag high
if high < baseHigh and findDepth <= max_depth or (high == baseHigh and lower_close)
    flagLength += 1
else
    flagLength := 0

// begins starting bars once a low is higher than the flag low
if low > flagLowBear and findRally <= max_rally or (low == flagLowBear and higher_close)
    flagLengthBear += 1
else
    flagLengthBear := 0

// check for prior uptrend / downtrend to meet requirements
// loops through all the bars from the minimum pole length to the maximum pole length to check if the prior uptrend requirements are met and sets the variables to their new values
if high == baseHigh
    for i = poleMinLen to poleMaxLen
        if ((high / low[i]) - 1) * 100 >= poleMin
            flagBool := true
            poleLow := low[i]
            poleLowIndex := bar_index[i]
            break

// loops through all the bars from the minimum pole length to the maximum pole length to check if the prior downtrend requirements are met and sets the variables to their new values
if low == flagLowBear
    for i = poleMinLenBear to poleMaxLenBear
        if math.abs(((low / high[i]) - 1) * 100) >= poleMinBear
            flagBoolBear := true
            poleHigh := high[i]
            polehighIndex := bar_index[i]
            break


// reset variables if criteria for a flag is broken
// if the depth of the bull flag is greater than the maximum depth limit or the flag lasts longer than the maximum length everything is reset to beging looking for a new flag
if findDepth >= max_depth or flagLength > max_flag
    flagBool := false
    flagLength := 0
    baseHigh := na
    startIndex := na
    lowIndex := na
    baseLow := na

// if the rally of the bear flag is greater than the maximum rally limit or the flag lasts longer than the maximum length everything is reset to beging looking for a new flag
if findRally >= max_rally or flagLengthBear > max_flagBear
    flagBoolBear := false
    flagLengthBear := 0
    flagLowBear := na
    startIndexBear := na
    highIndex := na
    flagHigh := na

// reset the variables and begin looking for a new bull flag if price continues higher before the minimum flag length requirement is met
if high > baseHigh[1] and flagLength < min_flag
    baseHigh := high
    flagLength := 0
    startIndex := bar_index
    lowIndex := bar_index
    baseLow := low

// reset the variables and begin looking for a new bear flag if price continues lower before the minimum bear flag length requirement is met
if low < flagLowBear[1] and flagLengthBear < min_flagBear
    flagLowBear := low
    flagLengthBear := 0
    startIndexBear := bar_index
    highIndex := bar_index
    flagHigh := high


//define the flags
// if all requirements are met a bull flag is true, flagBool is true, flag length is less than maximum set length and more than miminum required. The prior run up also meets the requirements for length and price
flag = flagBool == true and flagLength < max_flag and findDepth < max_depth and flagLength >= min_flag and startIndex - poleLowIndex <= poleMaxLen

// if all requirements are met a bear flag is true, flagBoolBear is true, flag length is less than maximum set length and more than miminum required. The prior downtrend also meets the requirements for length and price
bearFlag = flagBoolBear == true and flagLengthBear < max_flagBear and findRally < max_rally and flagLengthBear >= min_flagBear and startIndexBear - polehighIndex <= poleMaxLen


//define flags, breakouts, breadowns
// a breakout is defined as the high going above the flag high and the length of the flag is greater than the minimum requirement. The flag boolean must also be true
breakout = high > baseHigh[1] and flagLength >= min_flag and flagBool == true
//a breakdown is defined as the depth of the flag being larger than user set parameter or the length of the flag exceeded the maximum flag length
breakdown = findDepth >= max_depth or flagLength > max_flag
// a separate variable to have breakouts only plot once using a plotshape
plotBO = flag[1] and high > baseHigh[1] and flagLength[1] >= min_flag and flagBool == true

// a bear flag breakout is defined as the low going below the flag low and the length of the flag is greater than the minimum requirement. The flag boolean must also be true
breakoutBear = low < flagLowBear[1] and flagLengthBear >= min_flagBear and flagBoolBear == true
//a breakdown is defined as the rally of the flag being larger than user set parameter or the length of the flag exceeded the maximum flag length
breakdownBear = findRally >= max_rally or flagLengthBear > max_flagBear
// a separate variable to have breakouts only plot once using a plotshape
plotBD = bearFlag[1] and low < flagLowBear[1] and flagLengthBear[1] >= min_flagBear and flagBoolBear == true

// // if a bul flag is detected and the user has bull flags selected from the settings menu draw it on the chart
// if flag and showF
//     //if a flag was detected on the previous bar, delete those lines and allow for new lines to be drawn
//     if flag[1]
//         line.delete(flagHLine[1]), line.delete(flagLLine[1]), line.delete(flagPLine[1])
//     //draw new lines
//     flagHLine := line.new(startIndex, baseHigh, bar_index, baseHigh, color=lineColor, width = lineWidth)
//     flagLLine := line.new(startIndex, baseLow, bar_index, baseLow, color=lineColor, width = lineWidth)
//     flagPLine := line.new(poleLowIndex +1, poleLow, startIndex , baseLow, color=lineColor, width = lineWidth)

// // if a bear flag is detected and the user has bear flags selected from the settings menu draw it on the chart
// if bearFlag and showBF
//     //if a bear flag was detected on the previous bar, delete those lines and allow for new lines to be drawn
//     if bearFlag[1]
//         line.delete(flagBearHLine[1]), line.delete(flagBearLLine[1]), line.delete(flagBearPLine[1])
//     //draw new lines
//     flagBearHLine := line.new(startIndexBear, flagHigh, bar_index, flagHigh, color=lineColorBear, width = lineWidthBear)
//     flagBearLLine := line.new(startIndexBear, flagLowBear, bar_index, flagLowBear, color=lineColorBear, width = lineWidthBear)
//     flagBearPLine := line.new(polehighIndex + 1, poleHigh, startIndexBear , flagHigh, color=lineColorBear, width = lineWidthBear)

//reset variables if a breakout occurs
if breakout // bull flag - high gets above flag high
    flagLength := 0
    baseHigh := high
    startIndex := bar_index
    lowIndex := bar_index
    baseLow := low

if breakoutBear // bear flag - low gets below flag low
    flagLengthBear := 0
    flagLowBear := low
    startIndexBear := bar_index
    highIndex := bar_index
    flagHigh := high

//reset the variables and highs from a failed bull flag. This allows stocks below previous highs to find new flags
highest = ta.highest(high, 10) // built in variable that finds the highest high lookingback the past 10 bars
if breakdown or flagLength == max_flag
    flagBool := false
    baseHigh := highest
    startIndex := bar_index
    lowIndex := bar_index
    baseLow := low

//reset the variables and lows from a failed bear flag. This allows stocks above previous lows to find new flags
lowest = ta.lowest(low, 10) // built in variable that finds the lowest low lookingback the past 10 bars
if breakdownBear or flagLengthBear == max_flagBear
    flagBoolBear := false
    flagLowBear := lowest
    startIndexBear := bar_index
    highIndex := bar_index
    flagHigh := high

// if a flag breakdowns remove the lines from the chart
// if (breakdown and flag[1])
//     line.delete(flagHLine)
//     line.delete(flagLLine)
//     line.delete(flagPLine)

// if (breakdownBear and bearFlag[1])
//     line.delete(flagBearHLine)
//     line.delete(flagBearLLine)
//     line.delete(flagBearPLine)

//plot breakouts
// use a plotshape to check if there is a breakout and the show breakout option is selected. If both requirements are met plot a shape at the breakout bar
plotshape(plotBO and showBO and showF, 'Breakout', shape.triangleup, location.belowbar, color.green)

// use a plotshape to check if there is a breakout and the show breakout option is selected. If both requirements are met plot a shape at the breakout bar
plotshape(plotBD and showBD and showBF, 'Breakout', shape.triangledown, location.abovebar, color.red)

// Define entry and exit conditions based on the indicator
bullishEntryFlag = plotBO and showBO and showF
bearishEntryFlag = plotBD and showBD and showBF

// Calculate Supertrend
[supertrend, direction] = ta.supertrend(SupertrendFactor, SupertrendPeriod)

bodyMiddle = plot((open + close) / 2, display=display.none)
upTrend = plot(direction < 0 ? supertrend : na, "Up Trend", color = color.green, style=plot.style_linebr)
downTrend = plot(direction < 0? na : supertrend, "Down Trend", color = color.red, style=plot.style_linebr)

fill(bodyMiddle, upTrend, color.new(color.green, 90), fillgaps=false)
fill(bodyMiddle, downTrend, color.new(color.red, 90), fillgaps=false)

// Define entry and exit conditions based on the indicator
bullishEntryST = direction < 0
bearishEntryST = direction > 0

// Entry
bullishEntry = bullishEntryFlag and bullishEntryST
bearishEntry = bearishEntryFlag and bearishEntryST

// Modify entry and exit conditions based on the selected trading direction
if (bullishEntry and (tradingDirection == "Long" or tradingDirection == "Both"))
    strategy.entry("Buy", strategy.long)
    strategy.exit("Sell", "Buy", stop=supertrend)
if (bearishEntry and (tradingDirection == "Short" or tradingDirection == "Both"))
    strategy.entry("Sell", strategy.short)
    strategy.exit("Cover", "Sell", stop=supertrend)

// Exit conditions
if (strategy.position_size > 0 and bearishEntry and (tradingDirection == "Long" or tradingDirection == "Both")) // If in a long position and bearish entry condition is met
    strategy.close("Buy")
if (strategy.position_size < 0 and bullishEntry and (tradingDirection == "Short" or tradingDirection == "Both")) // If in a short position and bullish entry condition is met
    strategy.close("Sell")