動的なサポートとレジスタンスバンドに基づくトレンドフォロー戦略
作成日:
2023-12-26 11:57:20
最終変更日:
2023-12-26 11:57:20
コピー:
1
クリック数:
569
1
フォロー
1750
フォロワー
概要
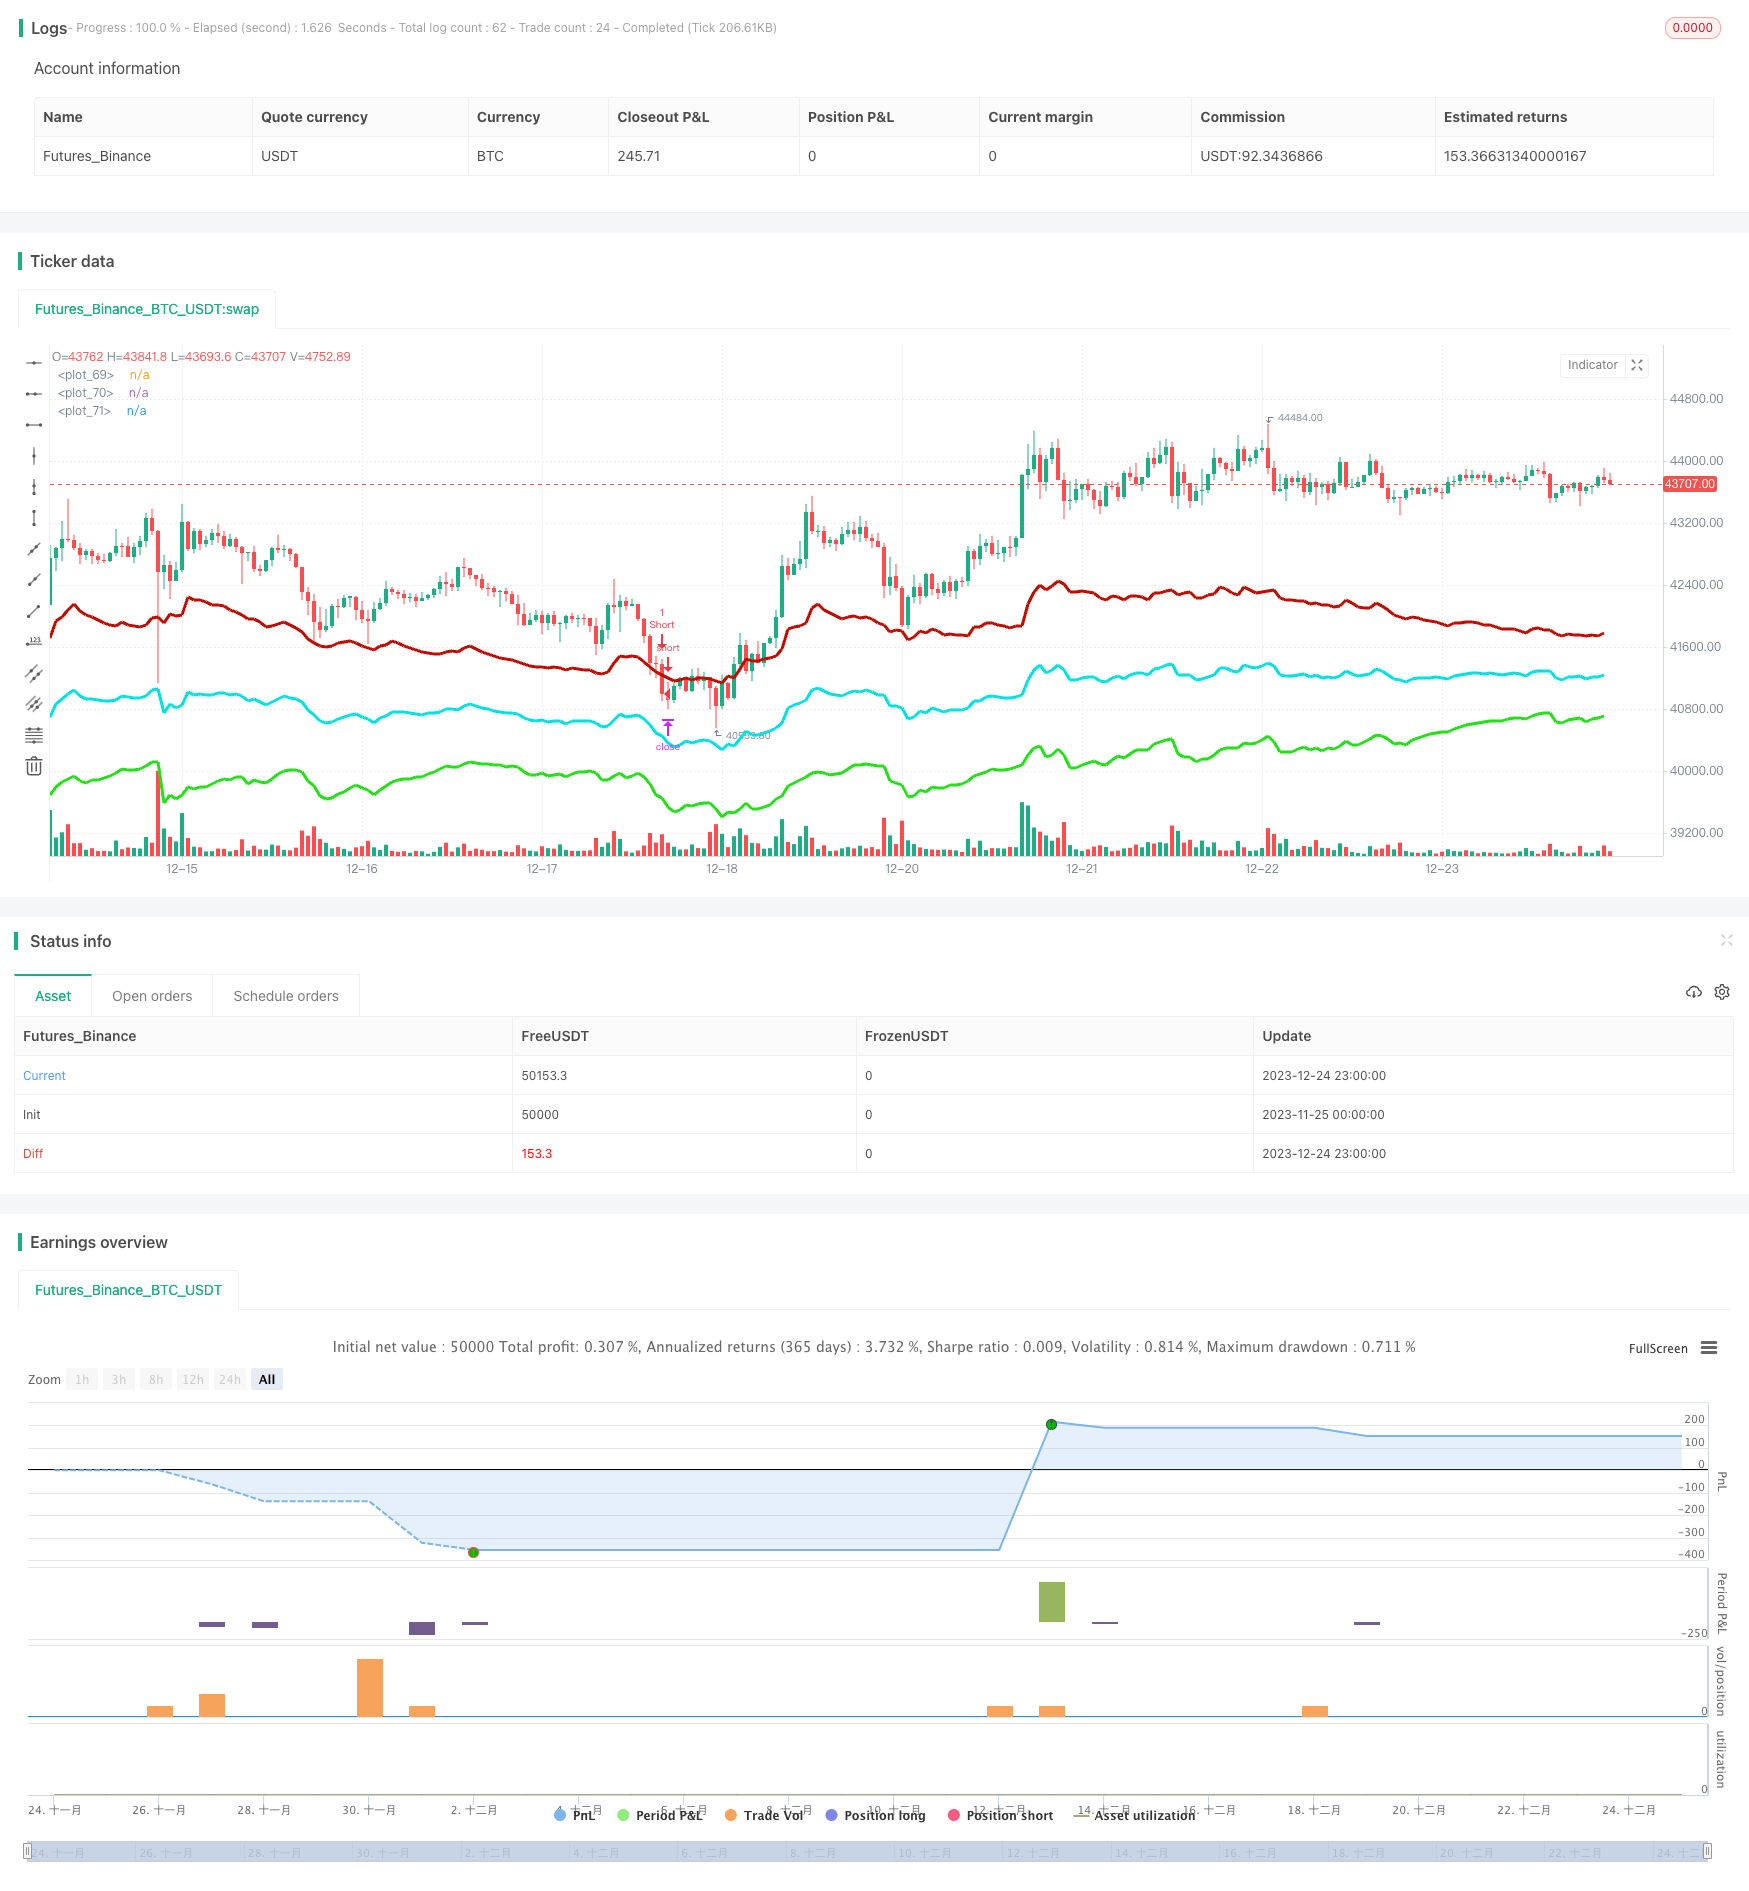
この戦略は,最近の一定の期間における最高価格と最低価格を計算し,現在の価格と組み合わせて,動的中軸を形成する.そして,最近の変動率に基づいて,赤の下方通道と緑の上方通道を生成する.この3つの通道線は,取引可能な範囲を形成する.価格が通道の境界に近づくと,反転操作を行う.
戦略原則
- 最近のN周期間の最高値と最低値を計算し,現在の閉店価格と組み合わせて動的中軸を形成する
- ATRと倍数によって生成された動的な通路帯,市場変動率による帯域の変化
- 下のチャネルラインから反発したときに多めに,上のチャネルラインから反発したときに空っぽに
- ストップとストップダストの論理で,中枢軸の停止に戻る
- トレンドインデックスを計算し,不順調な取引をフィルターします.
優位分析
- 市場変動をリアルタイムで捉える通路線位置の動的変化
- 順位取引の確率が高いため,トレンドを把握する
- 単一損失を制御するストップロジック
リスク分析
- パラメータの不適切な最適化は,過剰取引につながる可能性があります.
- 逆のトレンドを完全に排除できない
- 単方面突破線が継続される可能性
最適化の方向
- 経路のパラメータを調整して,異なる品種の特徴に適合させる
- トレンド指数のパラメータを調整し,順位上昇の確率を向上させる
- パラメータを動的に最適化するための機械学習要素を追加
要約する
この戦略は,主に市場の揺れ特性を依存して利益を得る. ダイナミックチャネルを通じて価格の逆転点を捕捉し,トレンドフィルターと組み合わせて,逆転取引を効果的に利用して利益を得ることができ,同時にリスクをコントロールできます. 鍵は,パラメータとの調整であり,チャネルラインがリアルタイムで価格を追跡し,過度に敏感にならないようにする必要があります. 同時に,トレンド指数は,フィルタリングの役割を果たすのに適した周期を選択する必要があります. この戦略は理論的に順調であり,止損があります.実際の運用では,パラメータ最適化によって良いリターンを得ることができます.
ストラテジーソースコード
/*backtest
start: 2023-11-25 00:00:00
end: 2023-12-25 00:00:00
period: 1h
basePeriod: 15m
exchanges: [{"eid":"Futures_Binance","currency":"BTC_USDT"}]
*/

//@version=4
strategy(title="Strategy - Bobo PAPATR", overlay=true, default_qty_type = strategy.fixed, default_qty_value = 1, initial_capital = 10000)

// === STRATEGY RELATED INPUTS AND LOGIC ===
len = input(24, minval=1, title="Pivot Length, defines lookback for highs and lows to make pivots")
length = input(title="ATR lookback (Lower = bands more responsive to recent price action)", type=input.integer, defval=22)
myatr = atr(length)
dailyatr = myatr[1]
atrmult = input(title="ATR multiplier (Lower = wider bands)", type=input.float, defval=3)
pivot0 = (high[1] + low[1]  + close[1]) / 3

// PIVOT CALC
h = highest(len)
h1 = dev(h, len) ? na : h
hpivot = fixnan(h1)
l = lowest(len)
l1 = dev(l, len) ? na : l
lpivot = fixnan(l1)
pivot = (lpivot + hpivot + pivot0) / 3
upperband1 = (dailyatr * atrmult) + pivot
lowerband1 = pivot - (dailyatr * atrmult)
middleband = pivot

// == TREND CALC ===
i1=input(2, "Momentum Period", minval=1) //Keep at 2 usually
i2=input(20, "Slow Period", minval=1)
i3=input(5, "Fast Period", minval=1)
i4=input(3, "Smoothing Period", minval=1)
i5=input(4, "Signal Period", minval=1)
i6=input(50, "Extreme Value", minval=1)
hiDif = high - high[1]
loDif = low[1] - low
uDM = hiDif > loDif and hiDif > 0 ? hiDif : 0
dDM =  loDif > hiDif and loDif > 0 ? loDif : 0
ATR = rma(tr(true), i1)
DIu = 100 * rma(uDM, i1) / ATR
DId = 100 * rma(dDM, i1) / ATR
HLM2 =  DIu - DId
DTI = (100 * ema(ema(ema(HLM2, i2), i3), i4)) /  ema(ema(ema(abs(HLM2), i2), i3), i4)
signal = ema(DTI, i5)


// === RISK MANAGEMENT INPUTS ===
inpTakeProfit   = input(defval = 0, title = "Take Profit (In Market MinTick Value)", minval = 0)
inpStopLoss     = input(defval = 100, title = "Stop Loss (In Market MinTick Value)", minval = 0)

// === RISK MANAGEMENT VALUE PREP ===
// if an input is less than 1, assuming not wanted so we assign 'na' value to disable it.
useTakeProfit   = inpTakeProfit  >= 1 ? inpTakeProfit  : na
useStopLoss     = inpStopLoss    >= 1 ? inpStopLoss    : na

// === STRATEGY - LONG POSITION EXECUTION ===
enterLong = (((low<=lowerband1) and (close >lowerband1)) or ((open <= lowerband1) and (close > lowerband1))) and (strategy.opentrades <1) and (atr(3) > atr(50)) and (signal>signal[3])
exitLong = (high > middleband)
strategy.entry(id = "Long", long = true, when = enterLong)
strategy.close(id = "Long", when = exitLong)

// === STRATEGY - SHORT POSITION EXECUTION ===
enterShort = (((high>=upperband1) and (close < upperband1)) or ((open >= upperband1) and (close < upperband1))) and (strategy.opentrades <1) and (atr(3) > atr(50)) and (signal<signal[3])
exitShort = (low < middleband)
strategy.entry(id = "Short", long = false, when = enterShort)
strategy.close(id = "Short", when = exitShort)

// === STRATEGY RISK MANAGEMENT EXECUTION ===
strategy.exit("Exit Long", from_entry = "Long", profit = useTakeProfit, loss = useStopLoss)
strategy.exit("Exit Short", from_entry = "Short", profit = useTakeProfit, loss = useStopLoss)

// === CHART OVERLAY ===
plot(upperband1, color=#C10C00, linewidth=3)
plot(lowerband1, color=#23E019, linewidth=3)
plot(middleband, color=#00E2E2, linewidth=3)
//plot(strategy.equity, title="equity", color=red, linewidth=2, style=areabr)