ボリンジャーバンドチャネルRSI2ライン戦略
作成日:
2023-12-26 15:30:26
最終変更日:
2023-12-26 15:30:26
コピー:
0
クリック数:
1169
1
フォロー
1750
フォロワー
概要
この戦略は,ブリンラインと比較的強い指標 ((RSI)) を組み合わせて,RSI指標が超買い超売りしていると同時に,ブリンラインを突破する相応の上下軌道を必要とします.この戦略の取引信号は,より厳格で信頼性が高くなります.
戦略原則
- ブリン線を用いて,前期n日の閉盘価格に基づいて中軌道線,上軌道線,下軌道線を計算する.
- 市場が過度に看板か下落かを判断するためのRSI指標を計算する.
- RSI指標が超買い ((rsi_overboughtパラメータより高い) を示し,価格がブリン線上線を突破したときにのみ,空頭取引を行う.
- RSI指標がオーバーソール (rsi_oversoldパラメータより低い) と,価格がブリン下線線を突破したときにのみ多頭取引を行う.
このように,この戦略は,ブリンラインの通路特性と,RSI指標の超買超売り信号を同時に利用し,単一の指標の判断誤りを回避し,より信頼性が高くなります.
戦略的優位性
- ブルインラインとRSIの優位性を総合的に利用し,判断を厳格にし,誤りを避ける.
- ブリンラインは市場変動の法則を把握するダイナミックな通路を設定する.
- RSIは超買いと超売りを判断し,高と低を追うのを避ける.
戦略リスク
- ブリンラインのパラメータが正しく設定されていない場合,上下線は価格を効果的に包み込むことができません.
- RSIのパラメータが正しく設定されていなければ,実際の超買超売を判断することができません.
- 戦略は,それだけでトレンドの方向を判断できないので,他の指標と組み合わせて使用する必要があります.
このリスクに対して,パラメータを最適化し,モデルを厳格にテストし,他の指標で大傾向を判断する.
戦略最適化の方向性
- 異なる周期パラメータのブリンラインをテストし,最適な周期パラメータを見つける.
- 異なるパラメータのRSI指標をテストし,優れているパラメータを決定する.
- 移動平均などの他の指標は,全体的な傾向を判断するために追加することができます.
要約する
この戦略は,ブリンラインとRSI指標の優位性を組み合わせて,両方の信号が同時に発生したときに取引指示を発行します. これにより,単一の指標の判断誤りの状況を効果的に回避し,取引をより信頼できます. 同時に,パラメータを最適化し,厳格にテストし,他の指標で大トレンドを判断することで,戦略の安定性と収益率をさらに向上させることができます.
ストラテジーソースコード
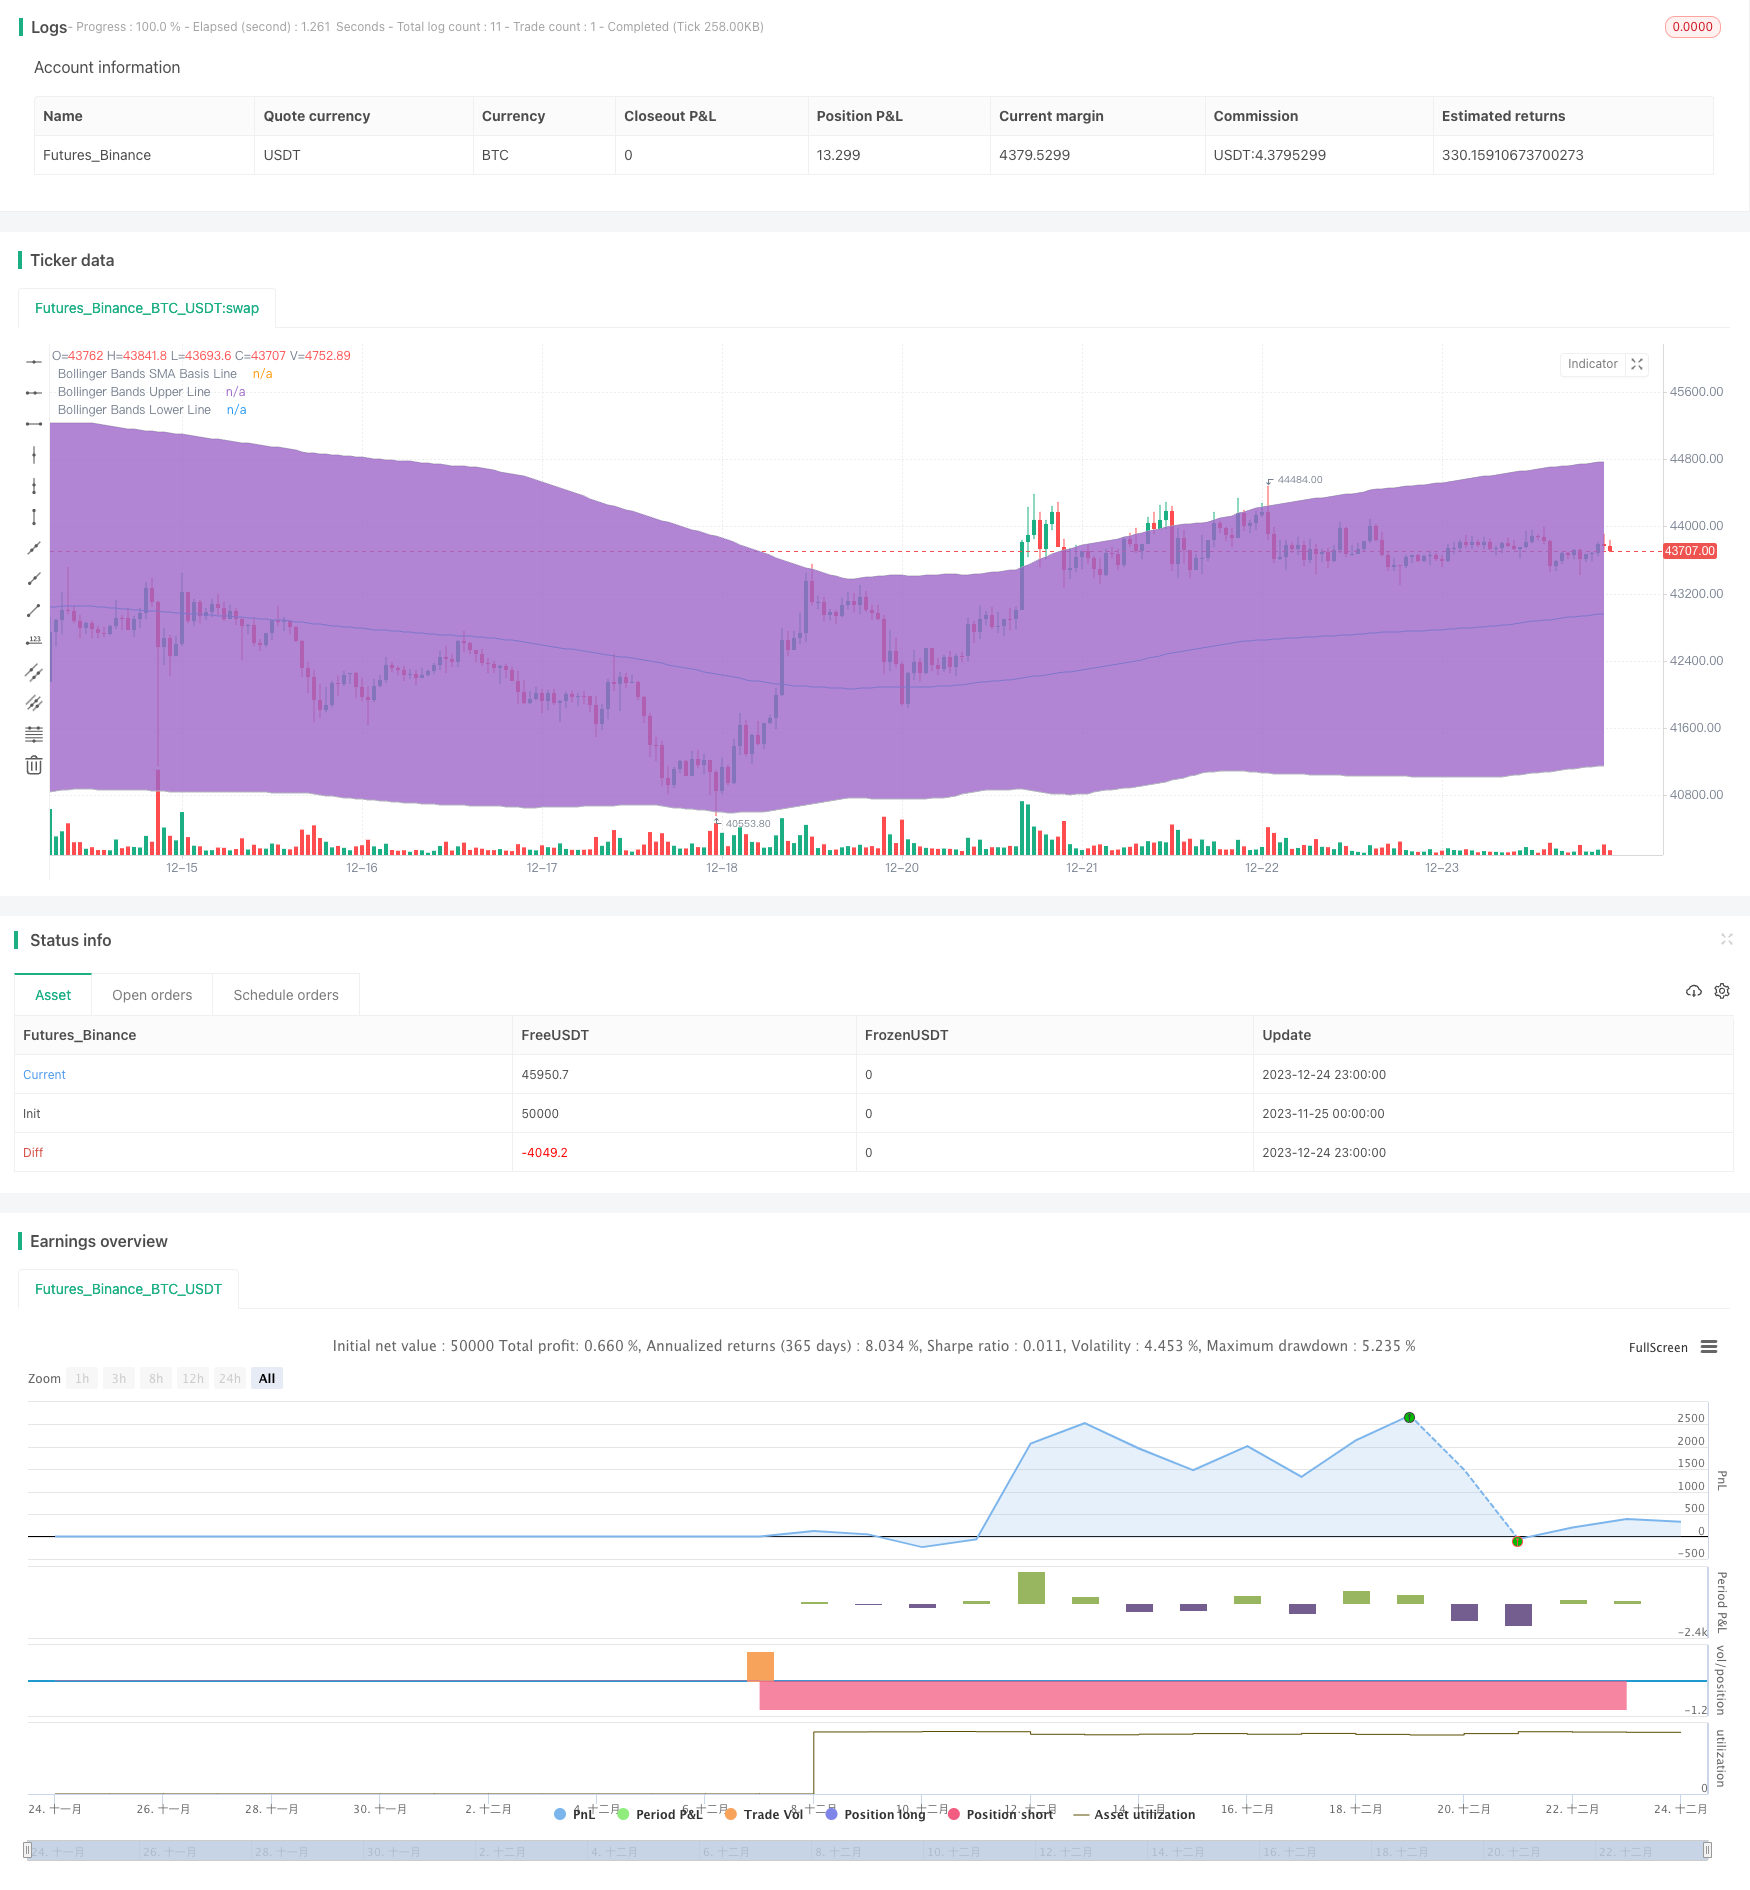
/*backtest
start: 2023-11-25 00:00:00
end: 2023-12-25 00:00:00
period: 1h
basePeriod: 15m
exchanges: [{"eid":"Futures_Binance","currency":"BTC_USDT"}]
*/

//@version=2
strategy("Bollinger + RSI, Double Strategy (by ChartArt) v1.1", shorttitle="CA_-_RSI_Bol_Strat_1.1", overlay=true)

// ChartArt's RSI + Bollinger Bands, Double Strategy - Update
//
// Version 1.1
// Idea by ChartArt on January 18, 2015.
//
// This strategy uses the RSI indicator
// together with the Bollinger Bands
// to sell when the price is above the
// upper Bollinger Band (and to buy when
// this value is below the lower band).
//
// This simple strategy only triggers when
// both the RSI and the Bollinger Bands
// indicators are at the same time in
// a overbought or oversold condition.
//
// In this version 1.1 the strategy was
// both simplified for the user and
// made more successful in backtesting.
//
// List of my work:
// https://www.tradingview.com/u/ChartArt/
//
//  __             __  ___       __  ___
// /  ` |__|  /\  |__)  |   /\  |__)  |
// \__, |  | /~~\ |  \  |  /~~\ |  \  |
//
//


///////////// RSI
RSIlength = input(6,title="RSI Period Length")
RSIoverSold = 50
RSIoverBought = 50
price = close
vrsi = rsi(price, RSIlength)


///////////// Bollinger Bands
BBlength = input(200, minval=1,title="Bollinger Period Length")
BBmult = 2 // input(2.0, minval=0.001, maxval=50,title="Bollinger Bands Standard Deviation")
BBbasis = sma(price, BBlength)
BBdev = BBmult * stdev(price, BBlength)
BBupper = BBbasis + BBdev
BBlower = BBbasis - BBdev
source = close
buyEntry = crossover(source, BBlower)
sellEntry = crossunder(source, BBupper)
plot(BBbasis, color=aqua,title="Bollinger Bands SMA Basis Line")
p1 = plot(BBupper, color=silver,title="Bollinger Bands Upper Line")
p2 = plot(BBlower, color=silver,title="Bollinger Bands Lower Line")
fill(p1, p2)


///////////// Colors
switch1=input(true, title="Enable Bar Color?")
switch2=input(true, title="Enable Background Color?")
TrendColor = RSIoverBought and (price[1] > BBupper and price < BBupper) and BBbasis < BBbasis[1] ? red : RSIoverSold and (price[1] < BBlower and price > BBlower) and BBbasis > BBbasis[1] ? green : na
barcolor(switch1?TrendColor:na)
bgcolor(switch2?TrendColor:na,transp=50)


///////////// RSI + Bollinger Bands Strategy
if (not na(vrsi))

    if (crossover(vrsi, RSIoverSold) and crossover(source, BBlower))
        strategy.entry("RSI_BB_L", strategy.long, stop=BBlower,  comment="RSI_BB_L")
    else
        strategy.cancel(id="RSI_BB_L")

    if (crossunder(vrsi, RSIoverBought) and crossunder(source, BBupper))
        strategy.entry("RSI_BB_S", strategy.short, stop=BBupper,  comment="RSI_BB_S")
    else
        strategy.cancel(id="RSI_BB_S")

//plot(strategy.equity, title="equity", color=red, linewidth=2, style=areabr)